VCF 9.1 — Real-time Data
A look at the real-time data and telemetry capabilities introduced in VMware Cloud Foundation 9.1.
One of the small-but-meaningful additions in VCF 9.1 is real-time data in the VCF Operations Workbench. For years you’ve been able to drop into vCenter’s Advanced Performance view and get a live look at what a host or VM is doing — handy when something is on fire right now. The catch was always that VCF Operations (formerly vROps / Aria Operations) collected on a coarser cadence, so when you wanted to correlate what you were seeing in vCenter with the broader operational picture, you were stuck flipping between tools and squinting at timestamps.
In 9.1 that gap closes. The Operations troubleshooting Workbench can now pull 2-second real-time data directly from the host, alongside the same scope, alerts, logs, and flows you already had.
Reference: Real-time Data in Troubleshooting Workbench — Broadcom techdocs
What’s new
- 2-second real-time metric collection in the VCF Operations Workbench — no more waiting for the next 5-minute roll-up to see if your change had an effect.
- Side-by-side correlation of real-time data with the rest of Operations’ context: scope tree, alerts, logs, and network flows on the same screen.
- Saved Workbench sessions so a real-time troubleshooting session (e.g. “VCF — ESXi Host Performance”) can be re-opened later instead of being rebuilt from scratch.
The “before” — vCenter Advanced Performance
For context, this is the view we’ve always had inside vCenter: the host’s Monitor → Performance → Advanced chart, in Real-time mode. It’s great for a focused look at a single object, but it lives in isolation from the rest of your monitoring stack.
For reference, the environment I’m pulling these screenshots from is a small lab cluster (pgvcf1-cl01) — three Ryzen 9 9955HX hosts with Memory Tiering enabled — so the numbers are modest but the workflow is identical at scale.
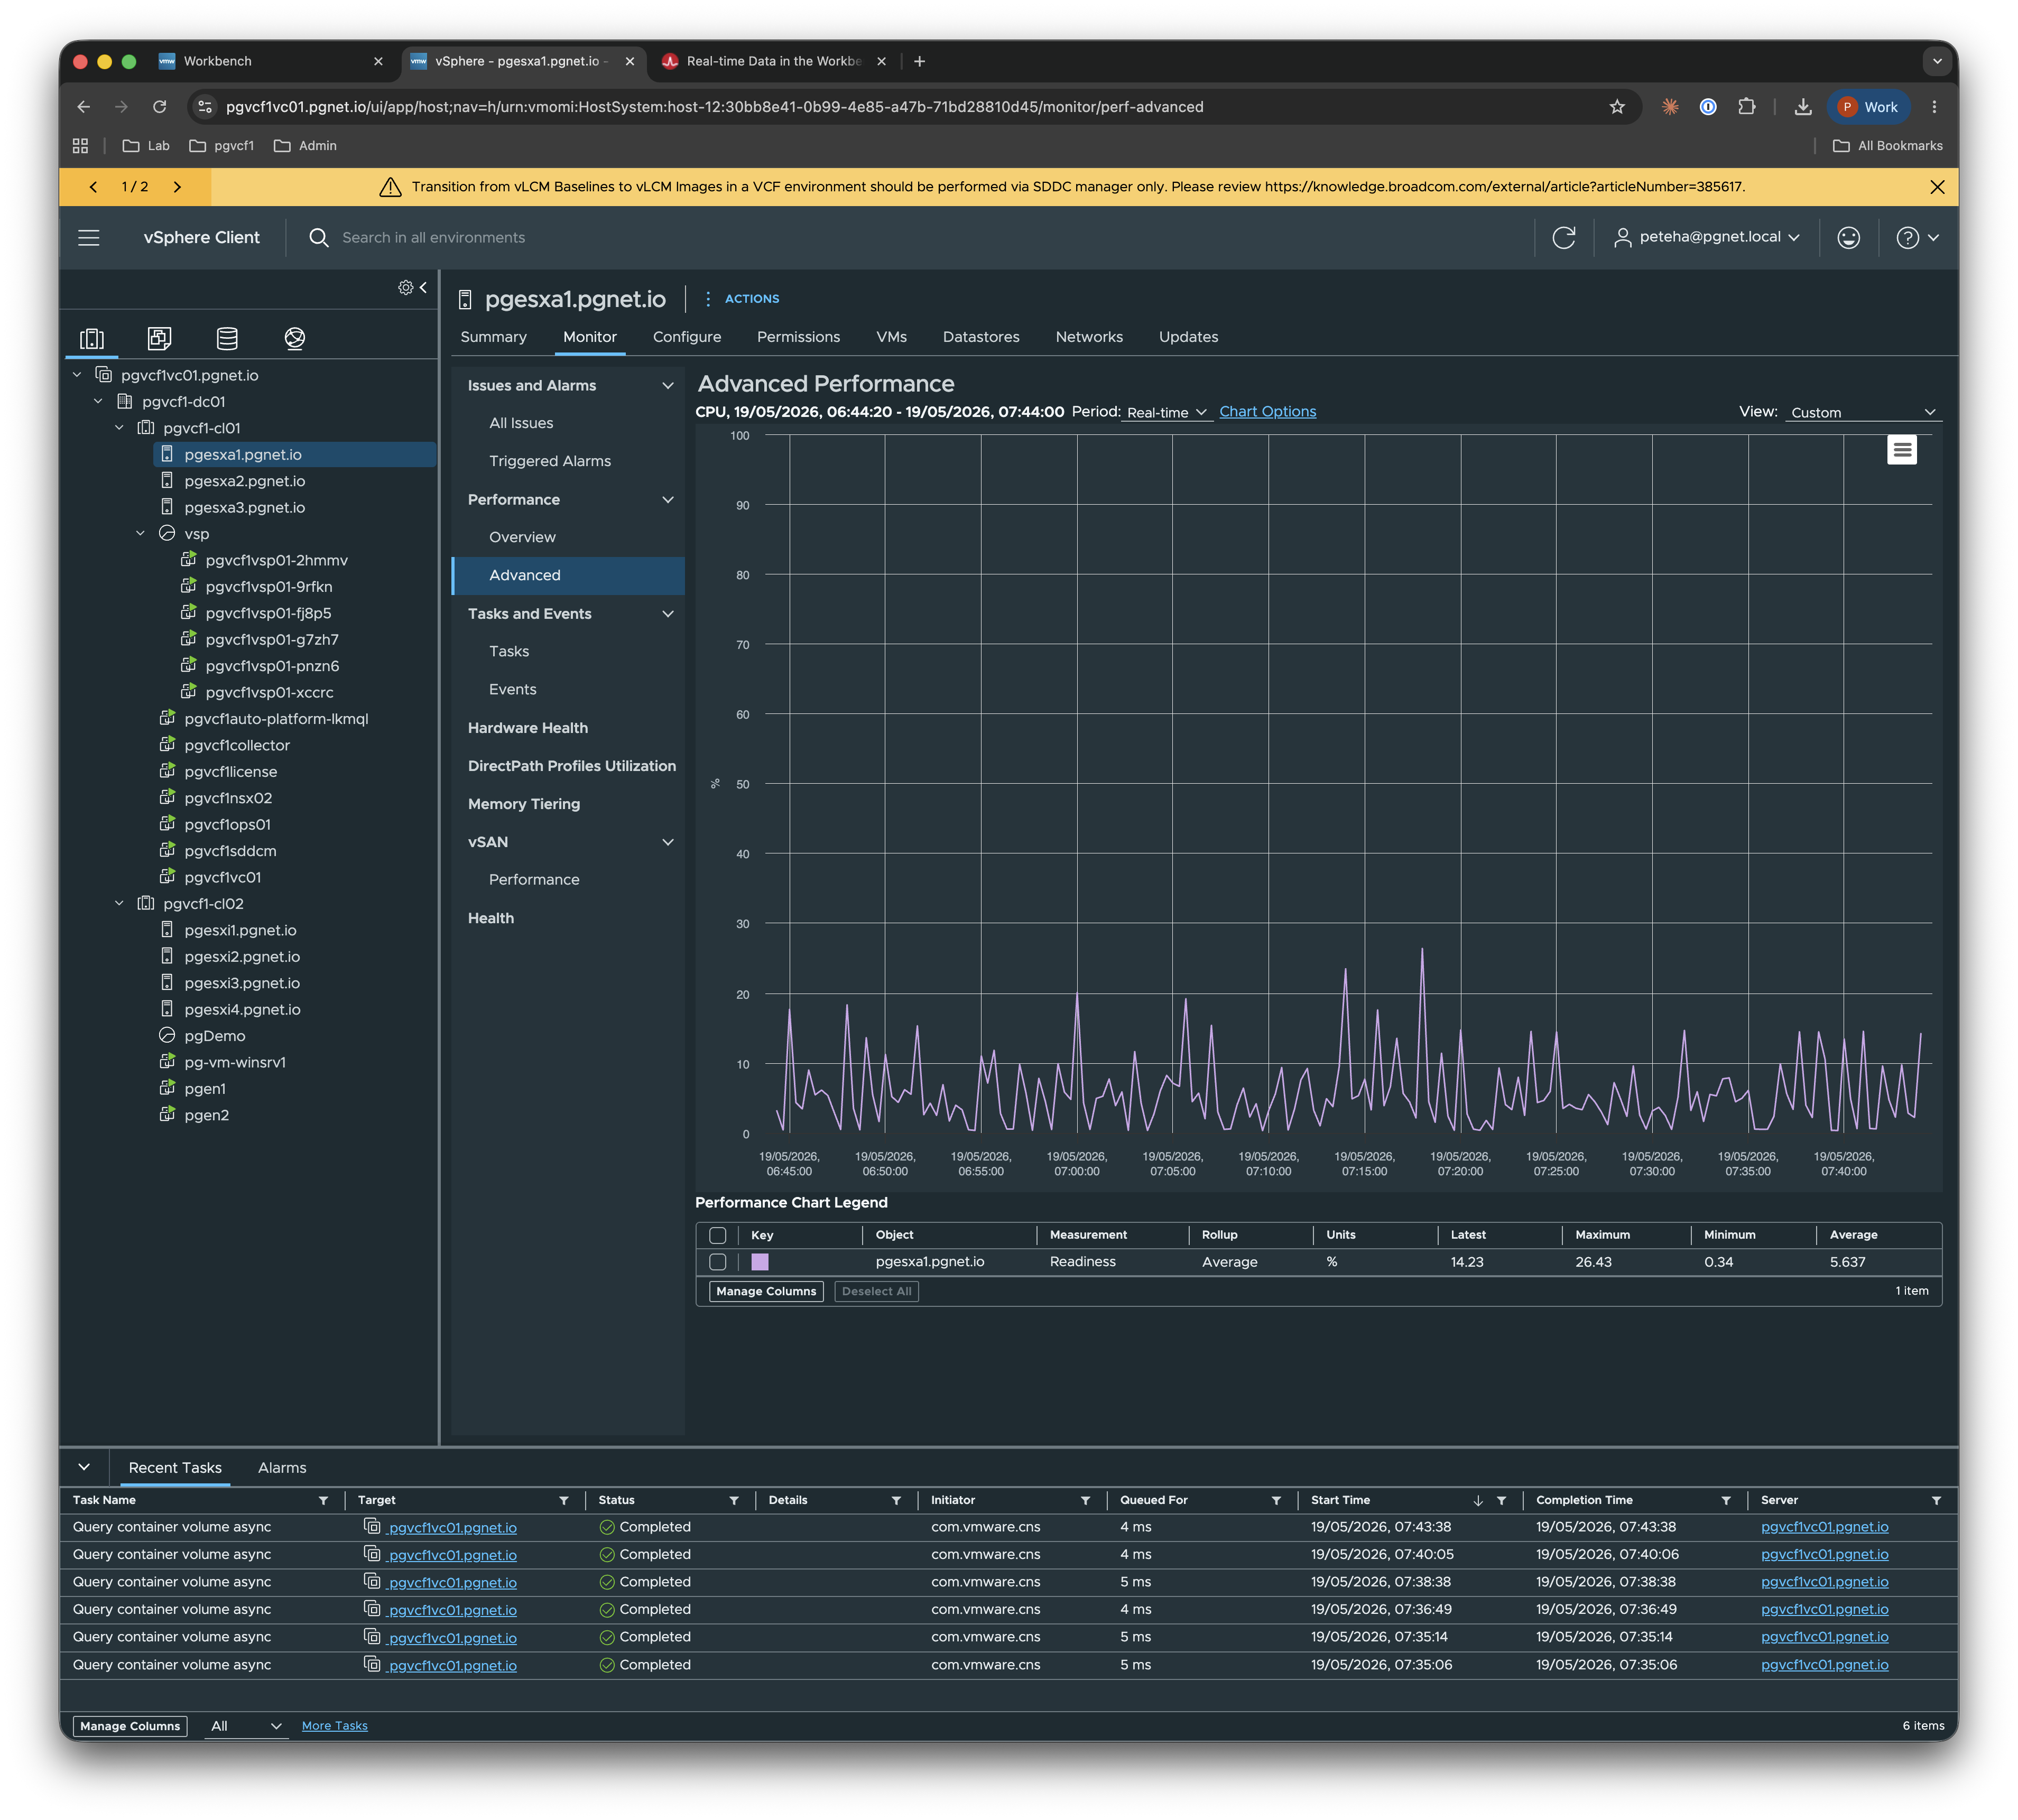
Useful, but you’re on your own to mentally line it up with what Operations is telling you — or end up pasting screenshots into a separate doc that ages badly the moment something changes.
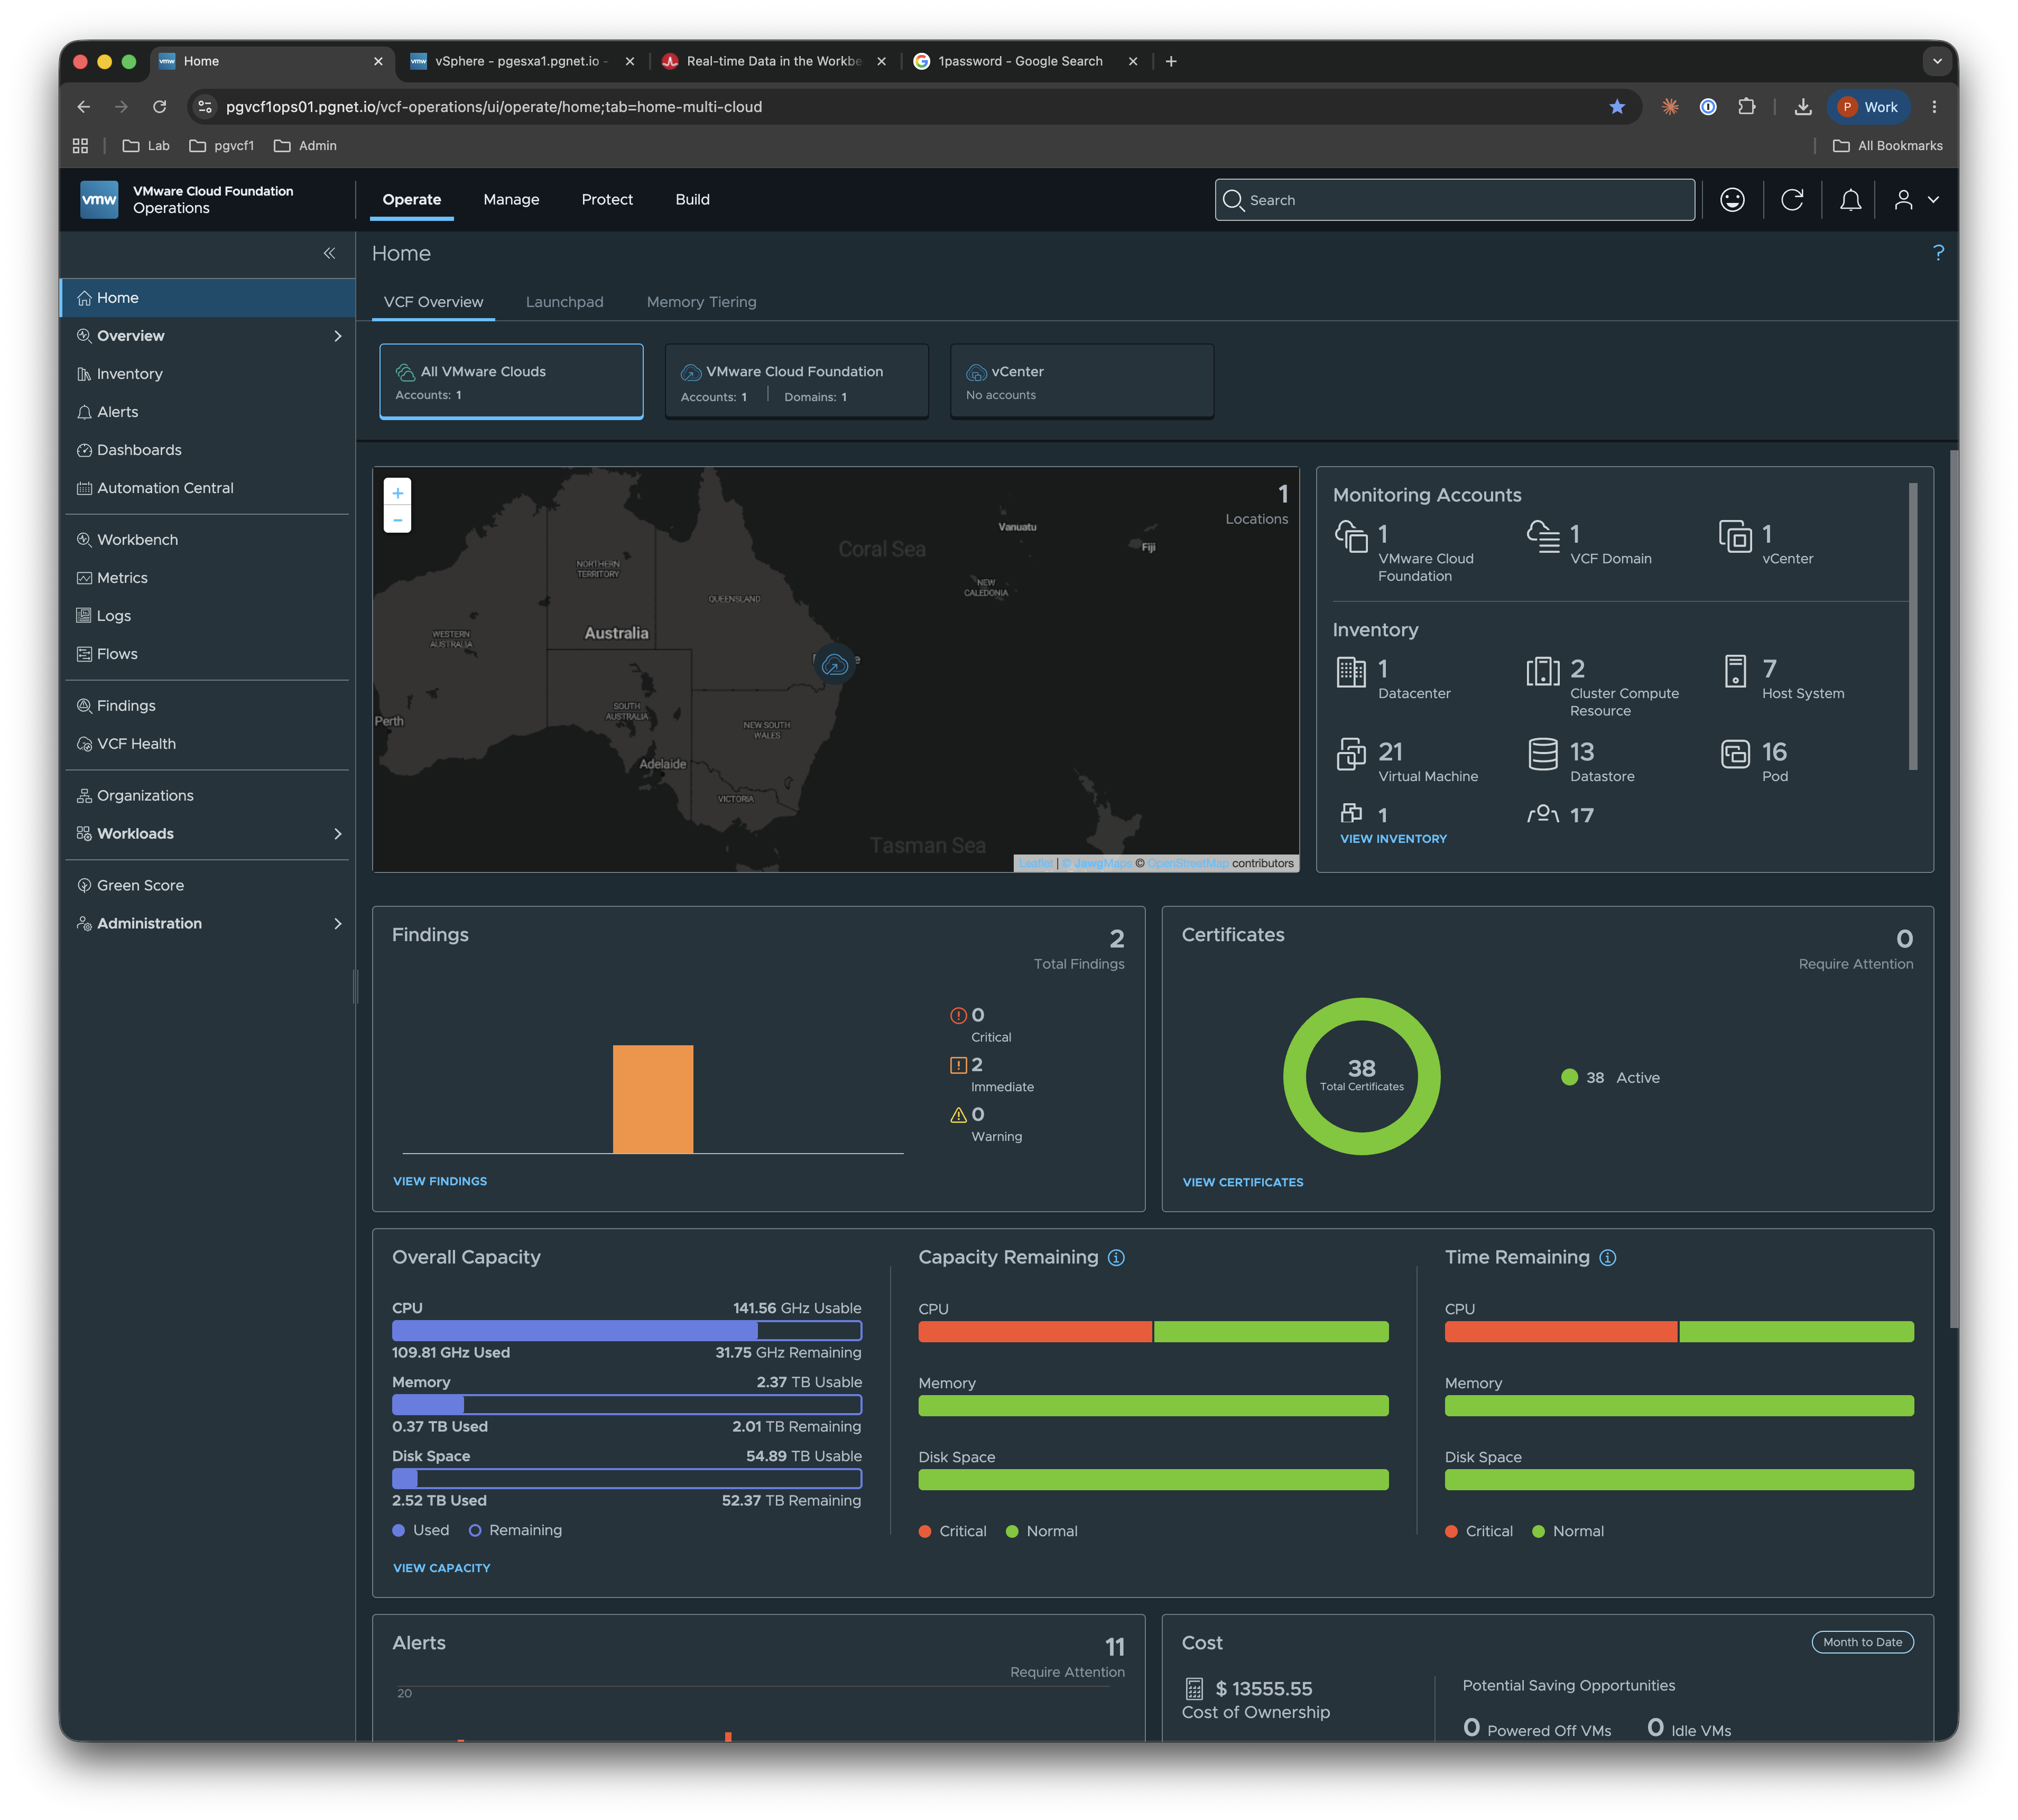
Where this lives in VCF Operations
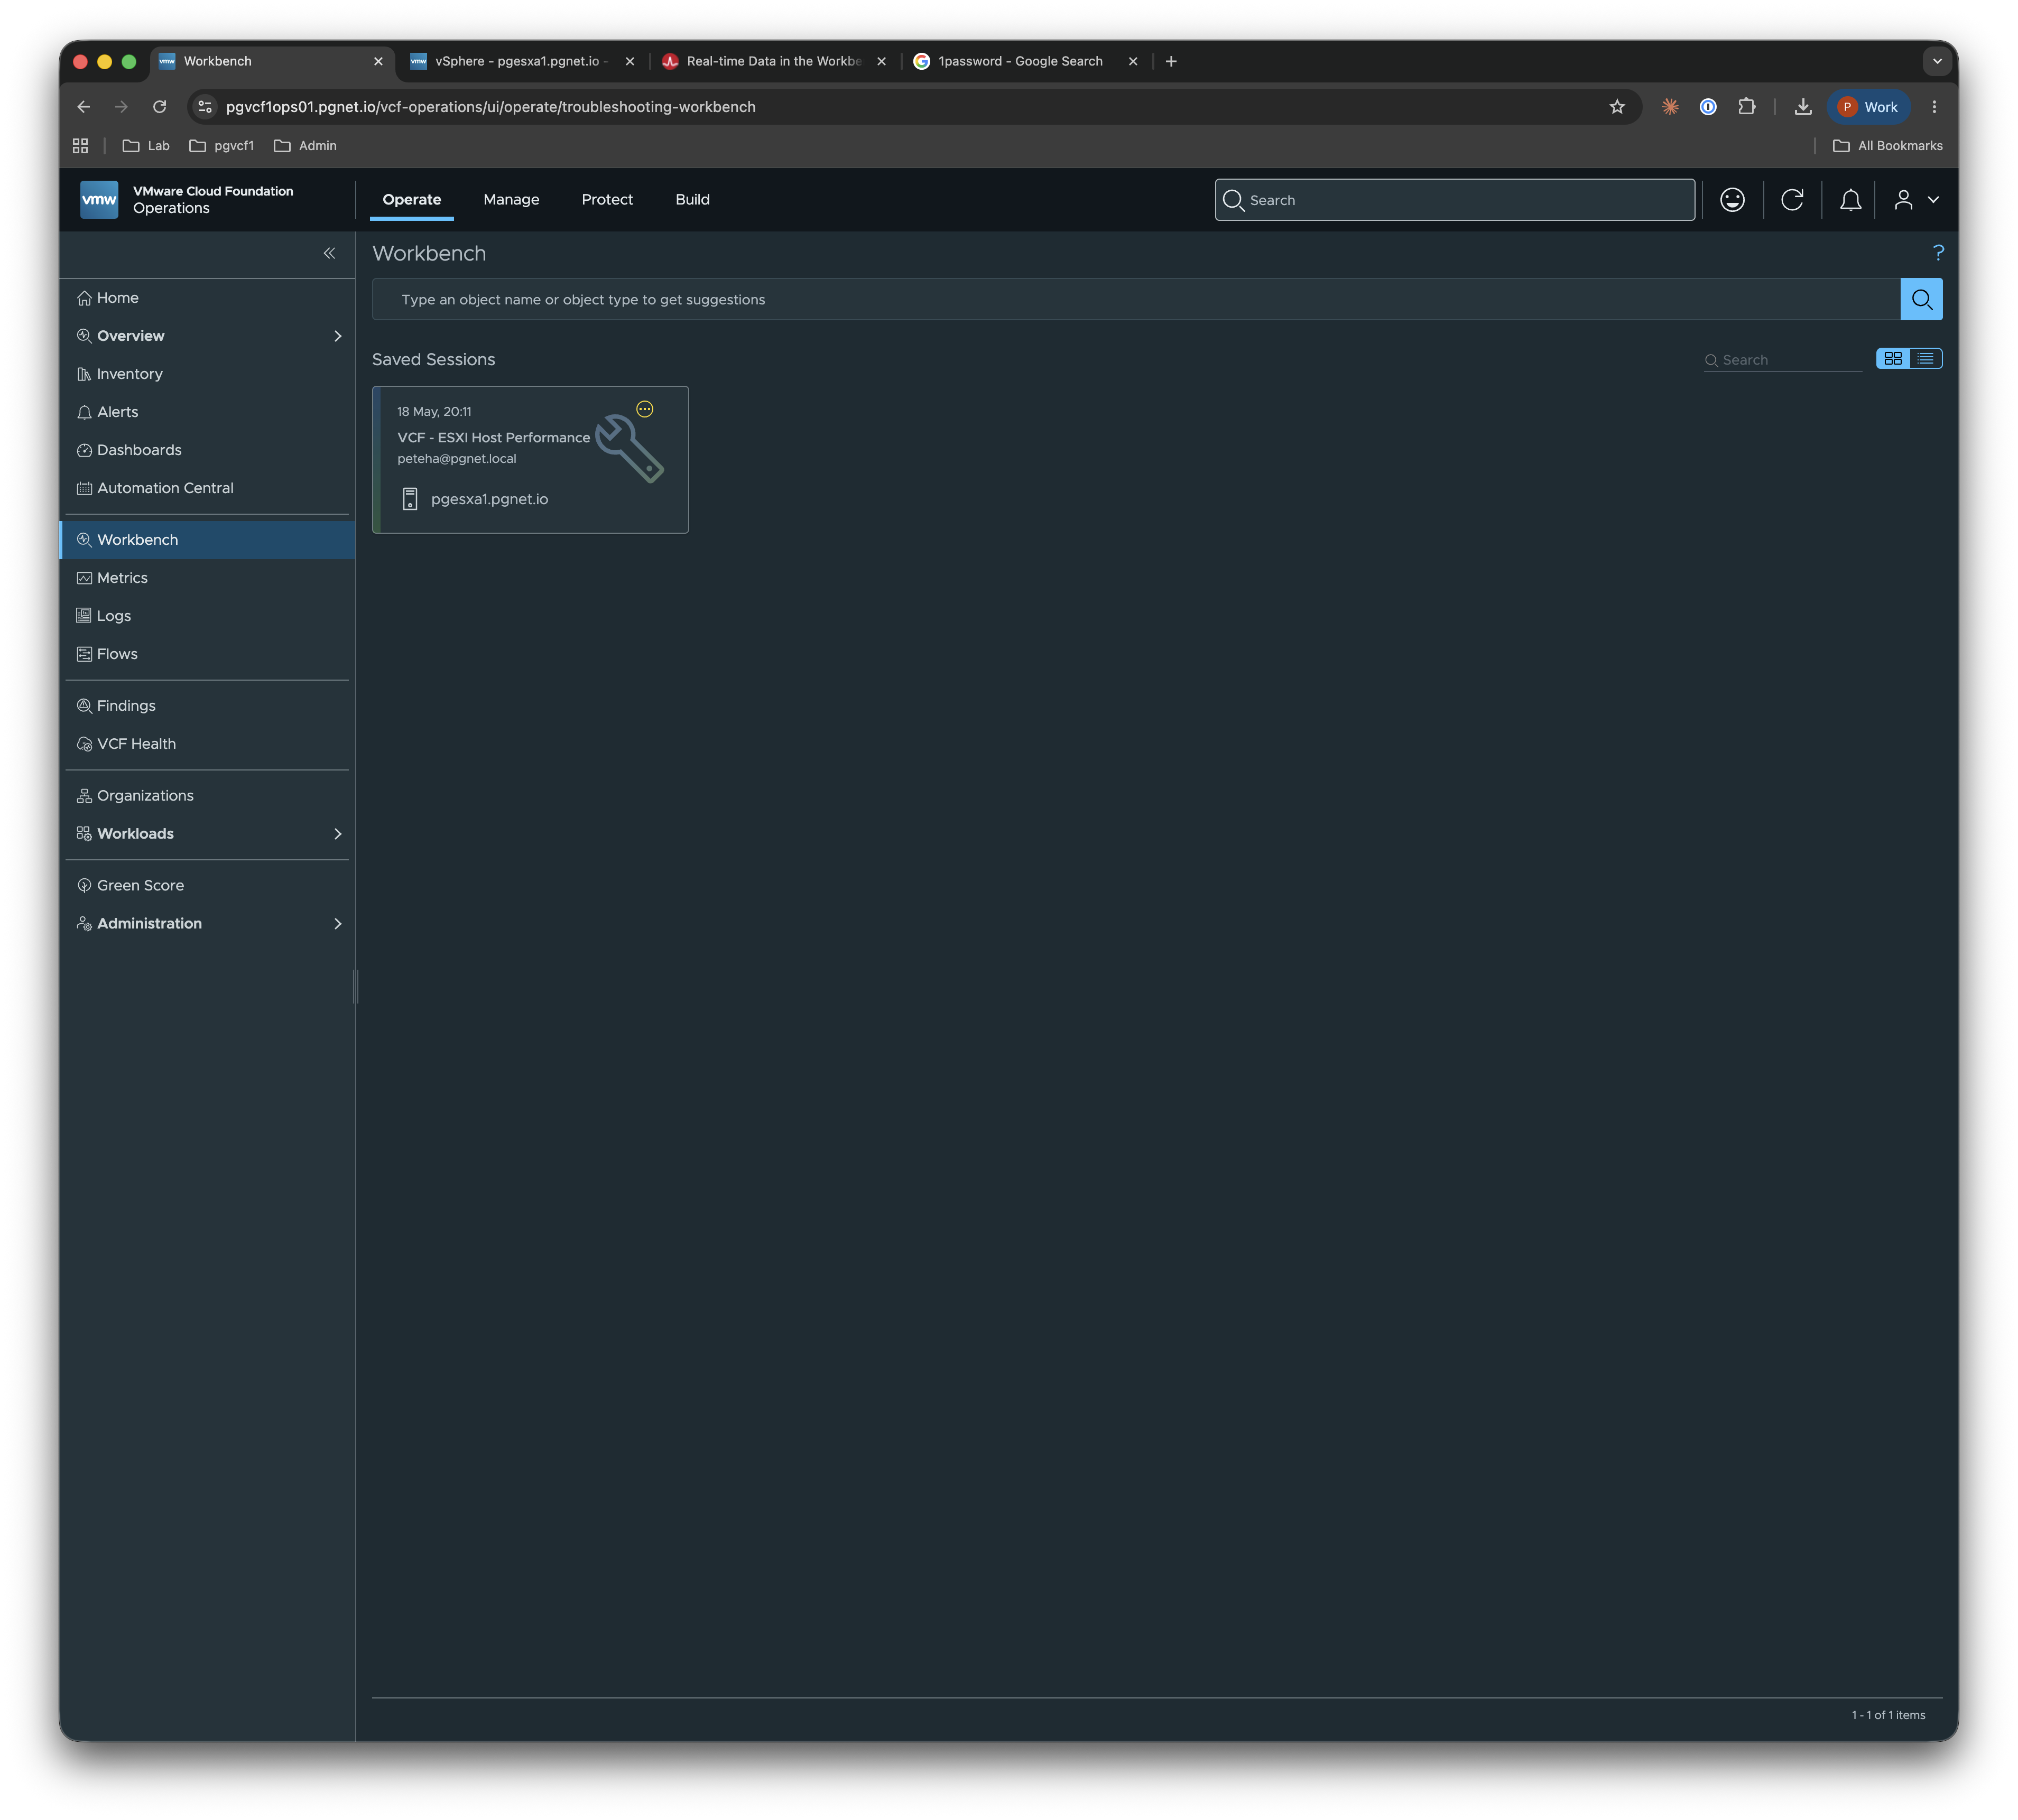
The Workbench sits under Operate → Workbench in VCF Operations. If you’ve used the troubleshooting workbench before, the layout is familiar — what’s new is the Real Time Analysis tab inside it.
Saved sessions show up on the Workbench landing page. In the screenshot below I have a saved VCF - ESXI Host Performance session pinned, so I can jump straight back in next time the same host starts misbehaving.
How it works
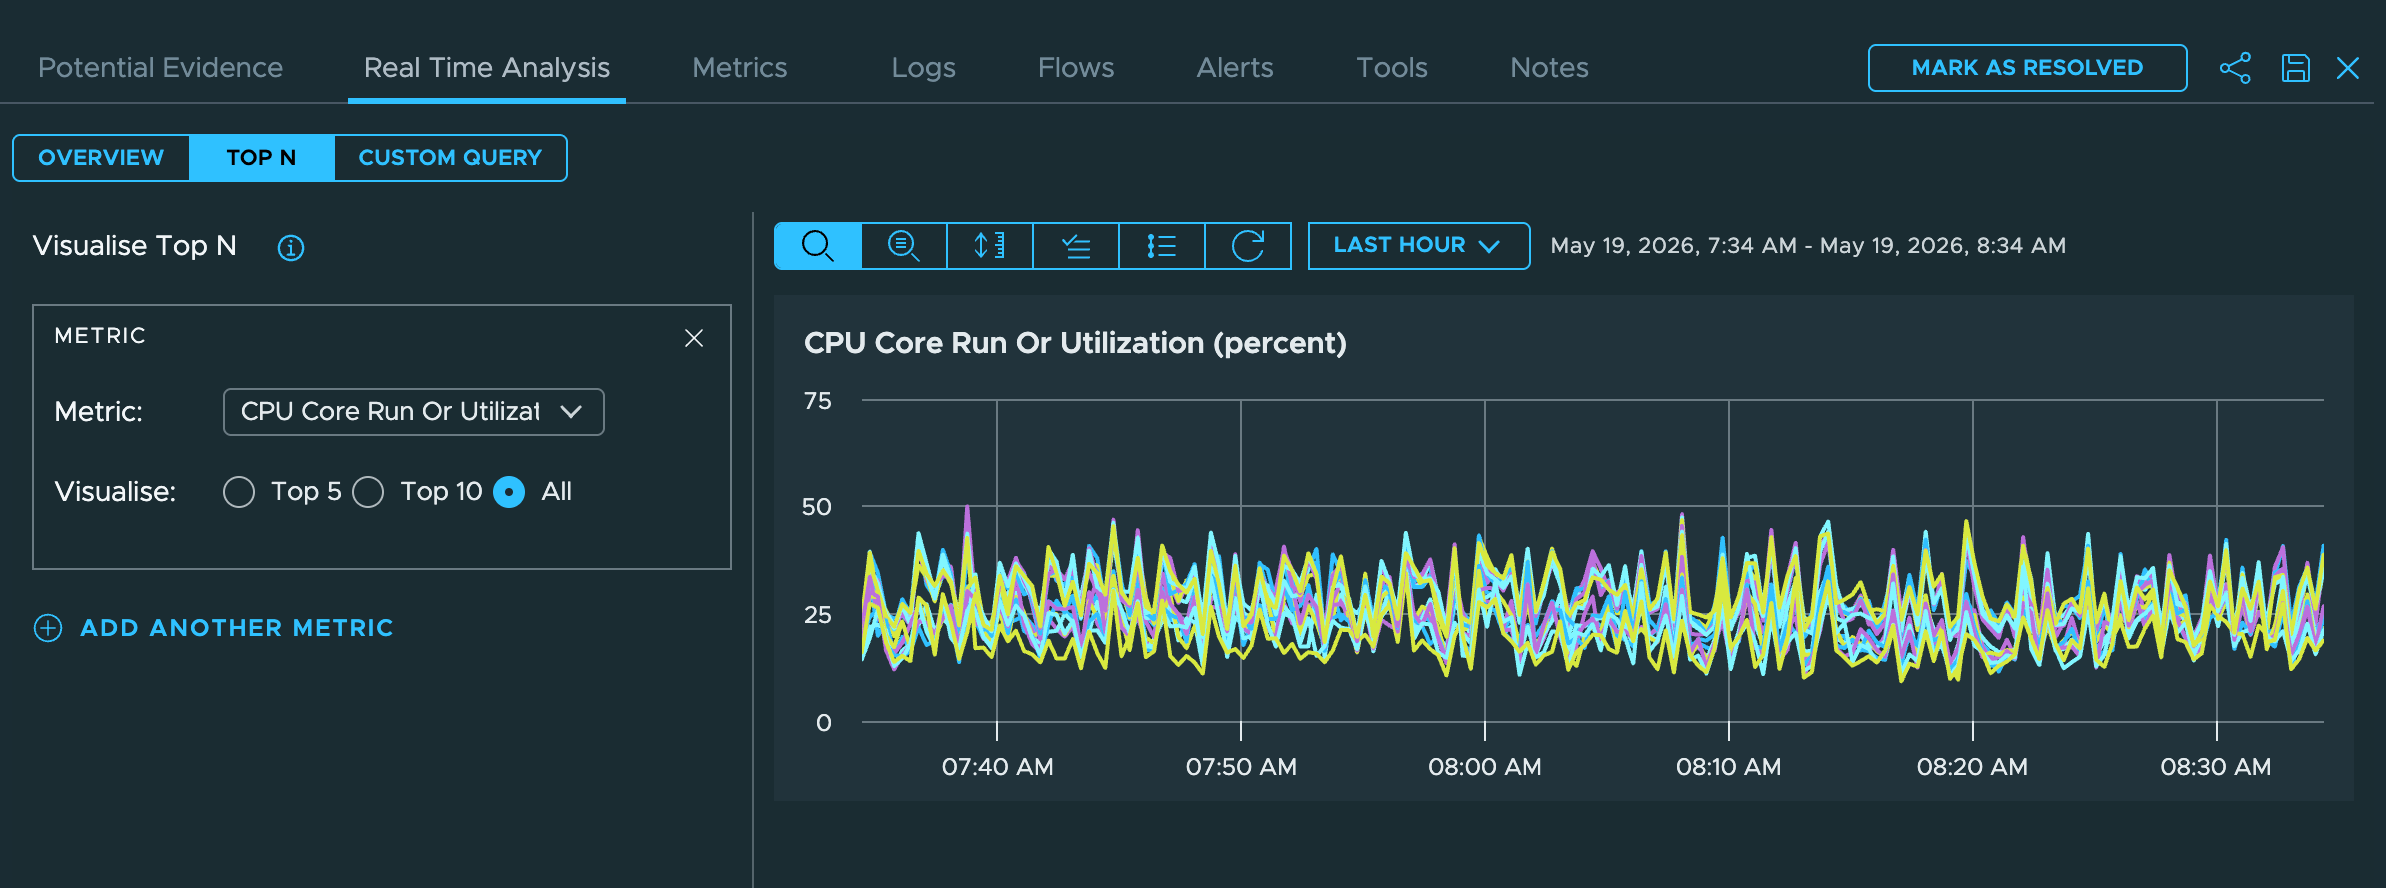
Open a session (or start a new one against a host, cluster, or VM) and pick the Real Time Analysis tab. You get the usual scope tree on the left — virtual machines, datastores, vSAN, host system, distributed switches, transport nodes, the cluster — and a Top N builder in the middle where you choose the metrics you want to chart.
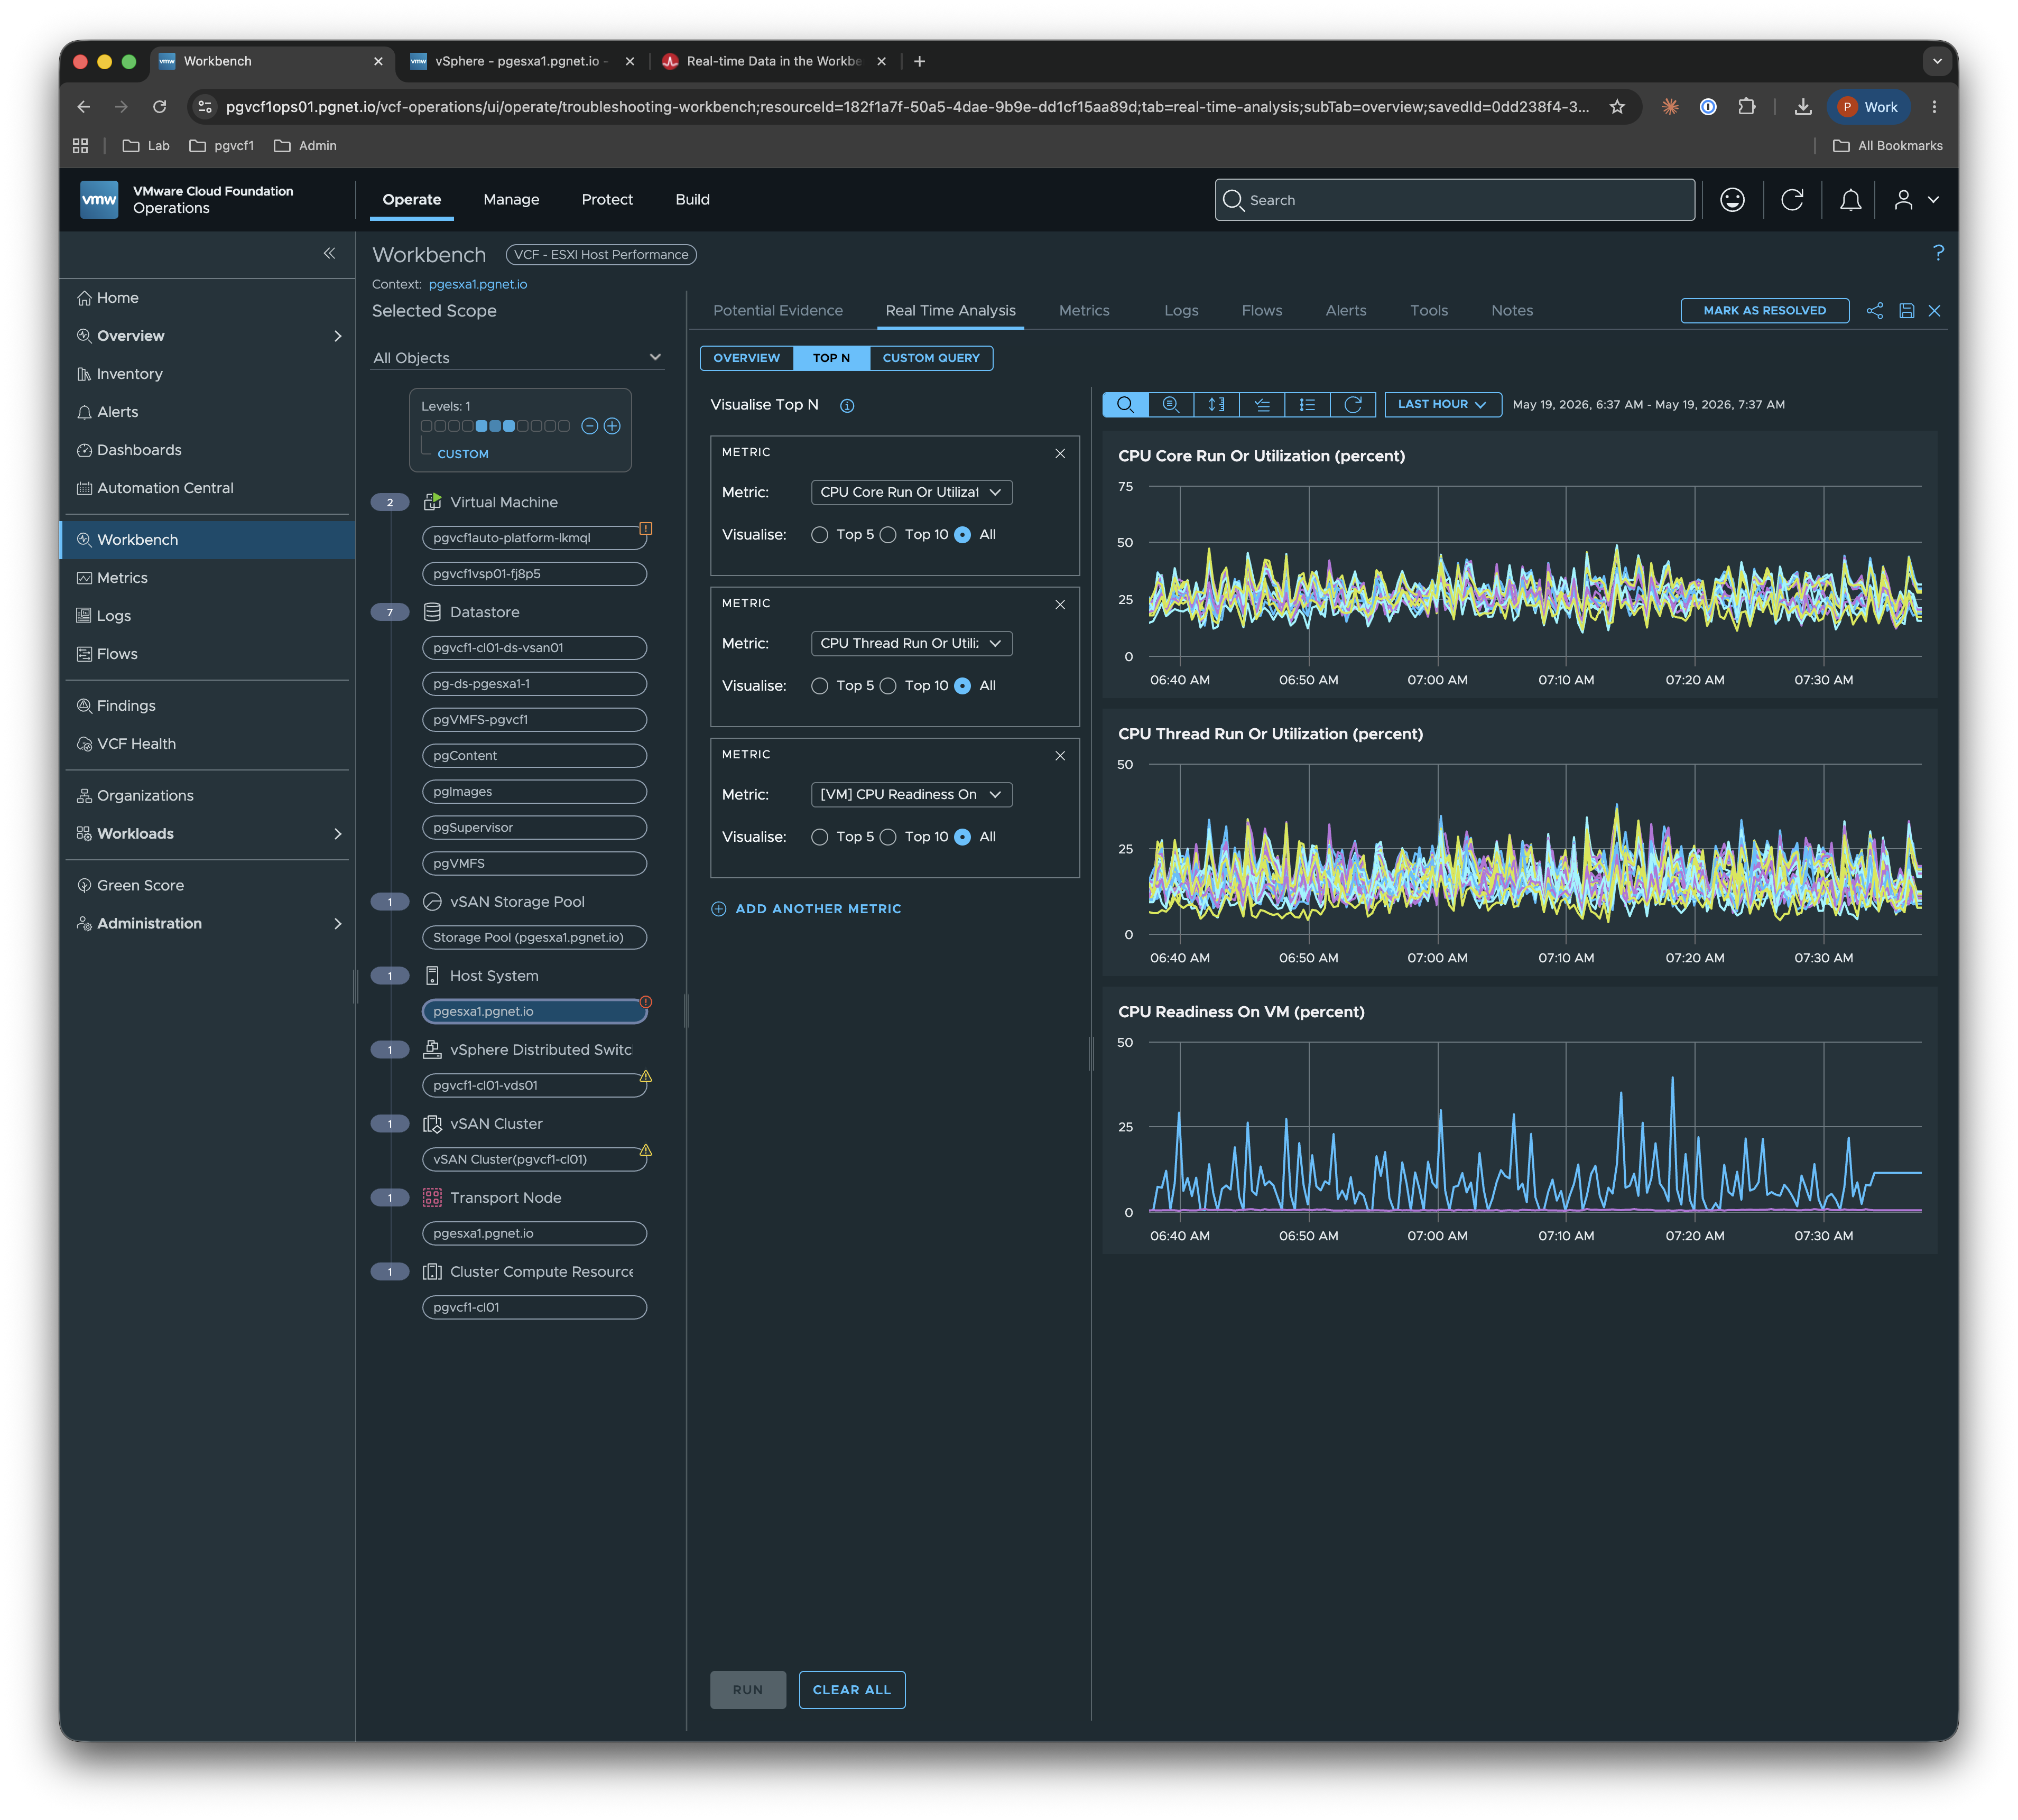
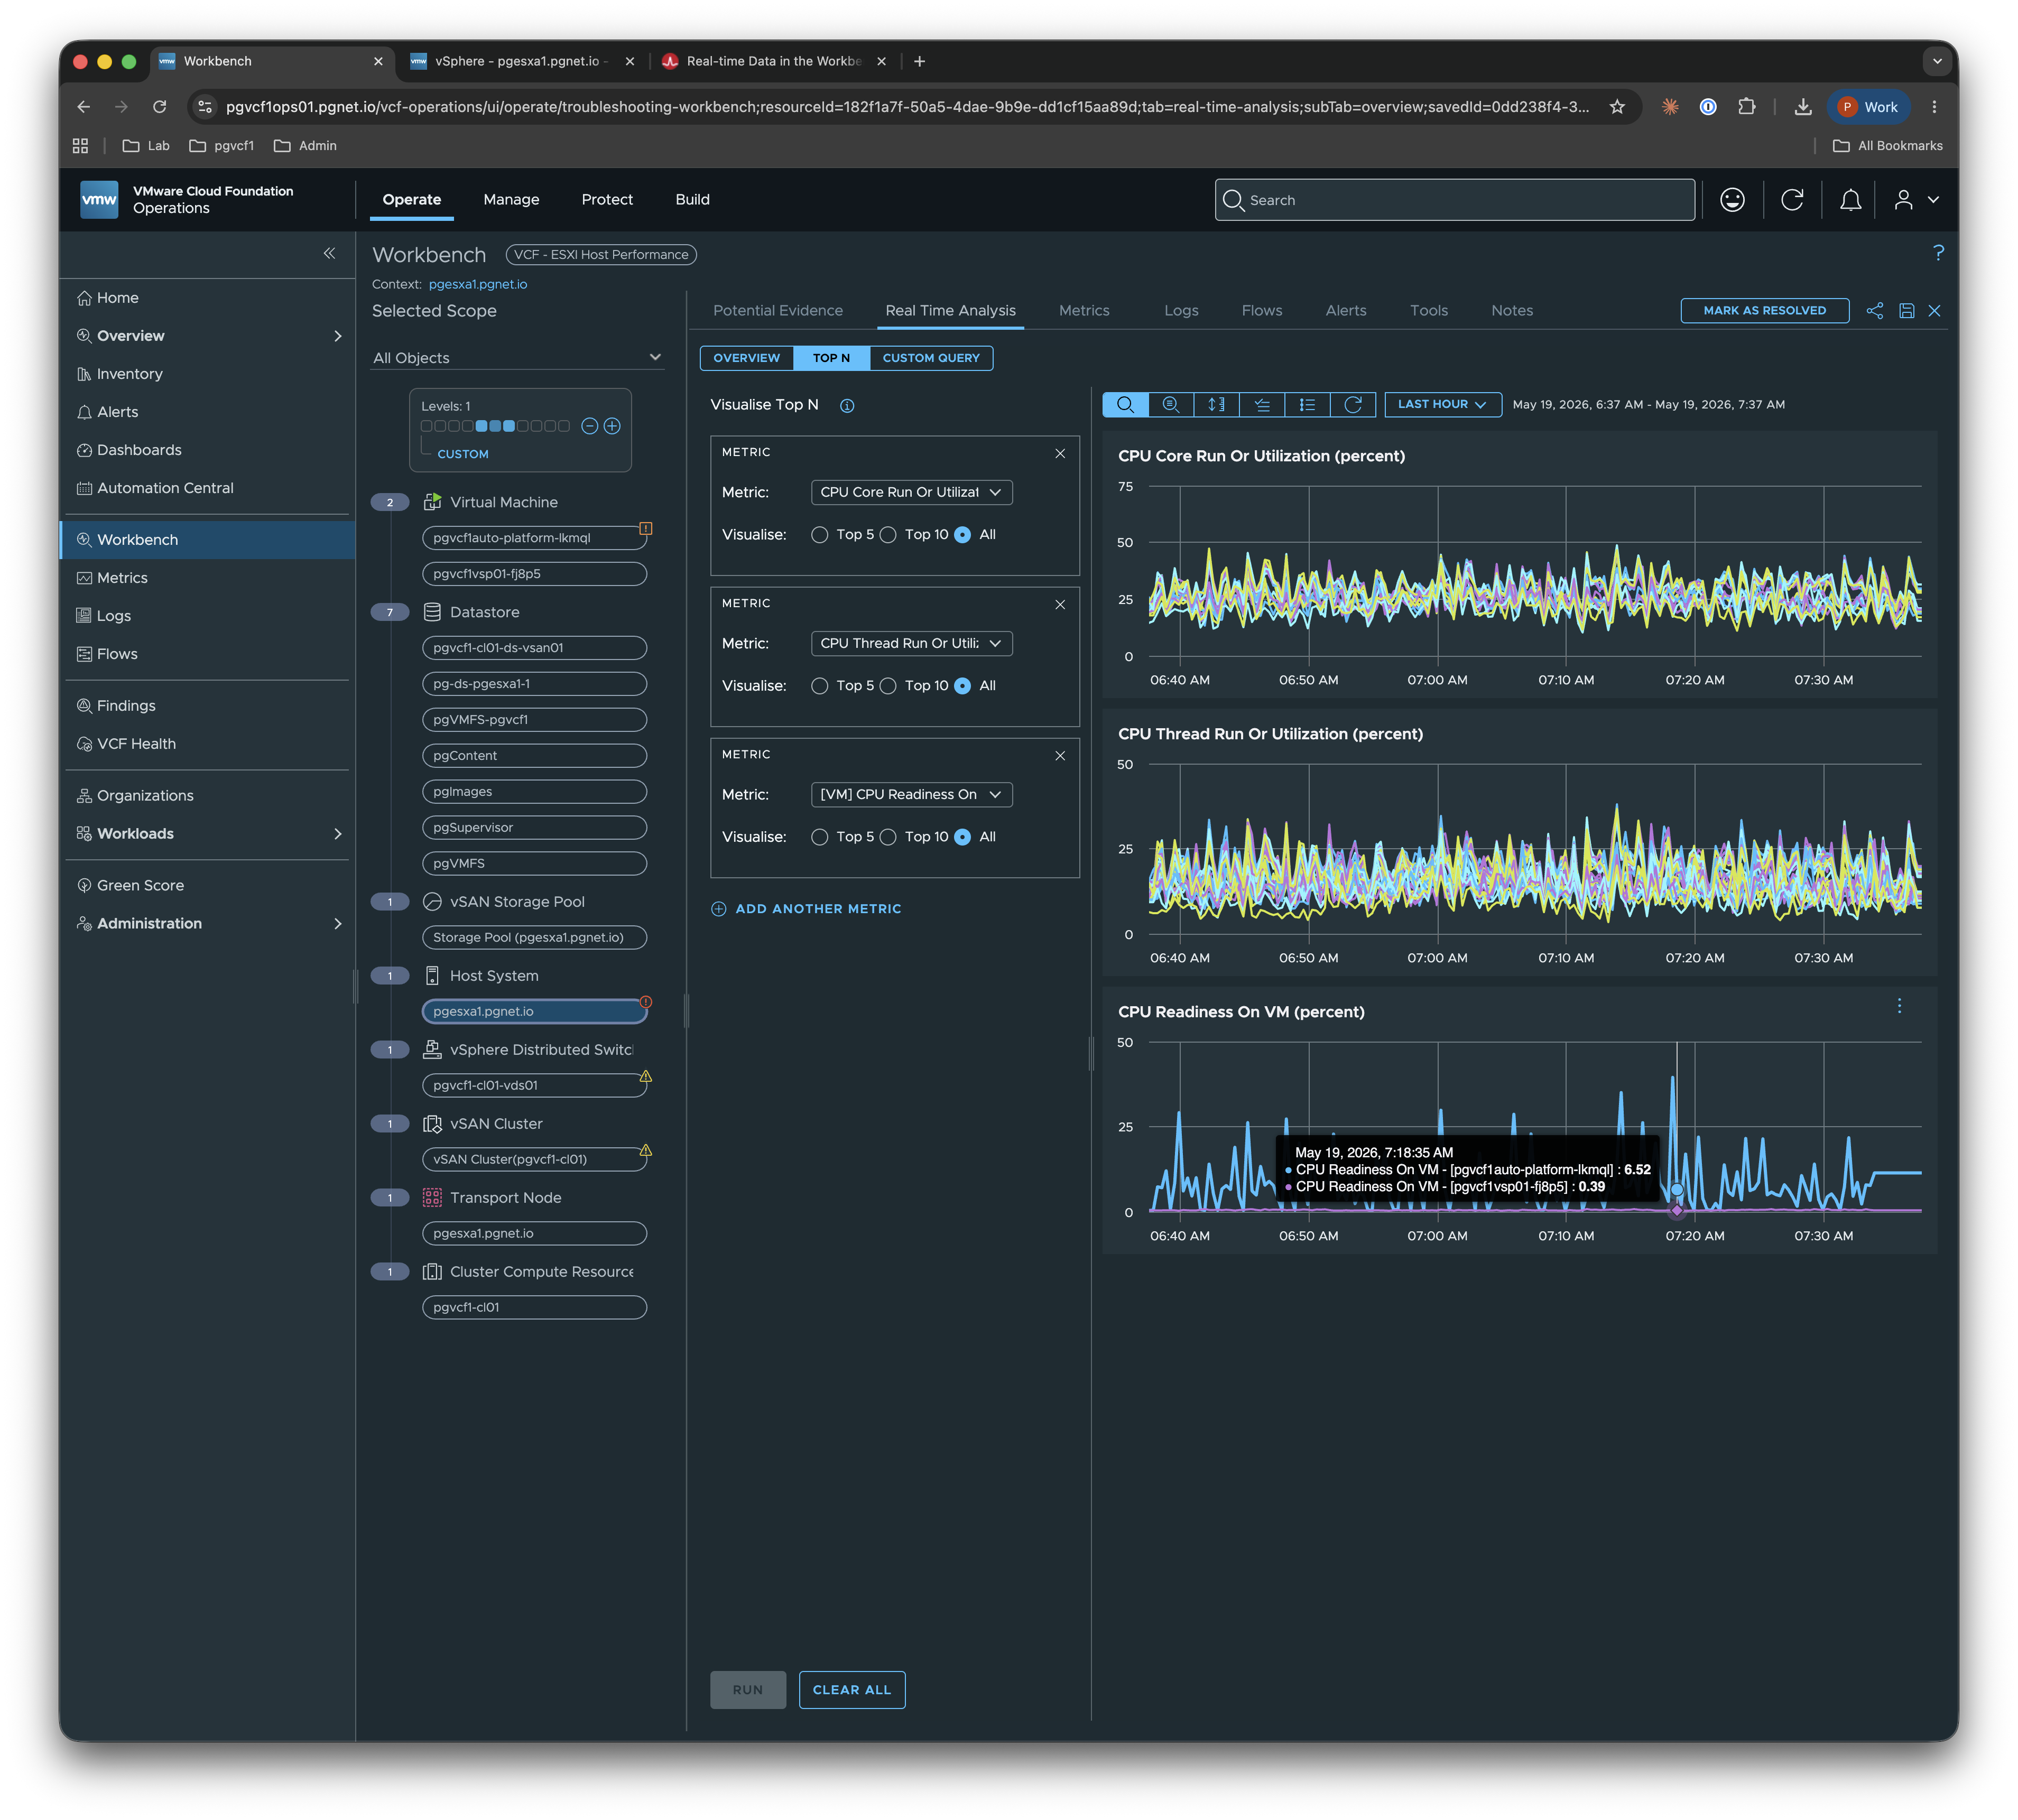
The charts on the right stream at the 2-second cadence and stack vertically so you can eyeball correlation across metrics — in this case CPU Core Run, CPU Thread Run, and per-VM CPU Readiness. Hovering on a series gives you the exact value and which VM it belongs to:
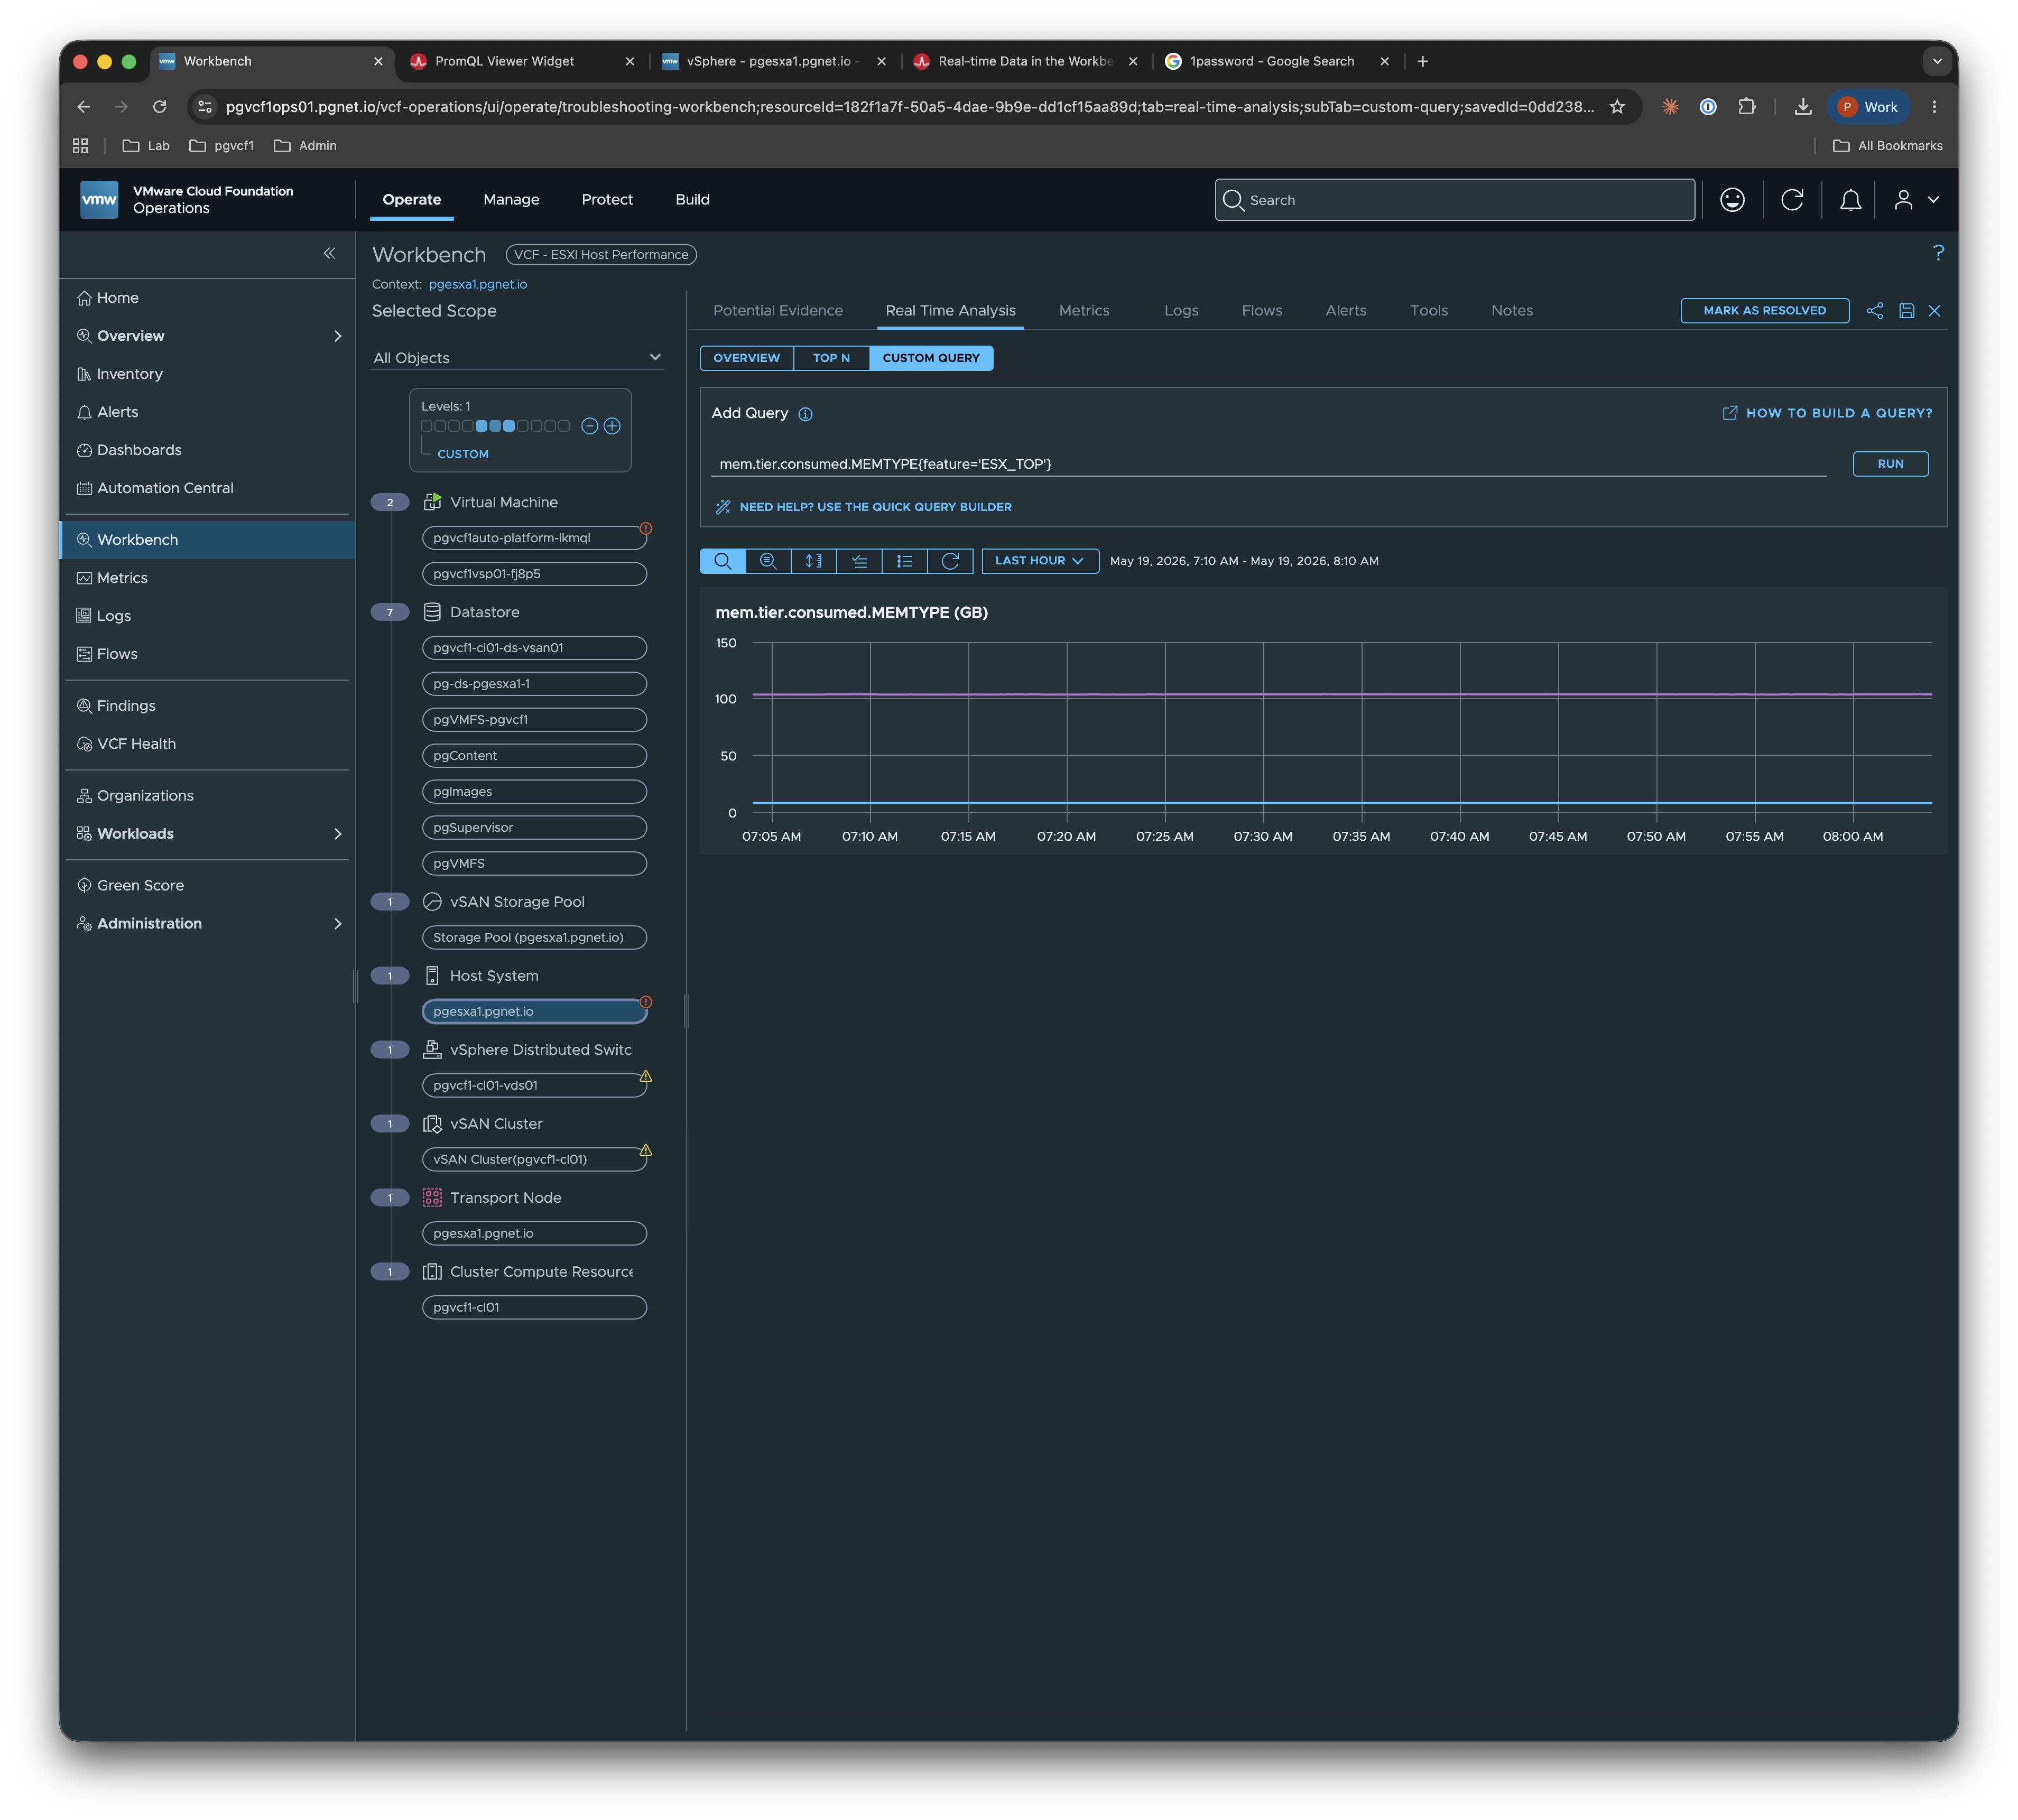
If you want to drive deeper than the Top N view, the Metrics tab gives you the full metric tree (CPU, Memory, Disk, Network, GPU, etc.) and lets you pin individual charts for the object you’re focused on. You can also write your own queries using PromQL.
What this replaces or improves
This doesn’t kill the vCenter Advanced Performance view — that’s still the right tool when you want a quick, host-local glance. What it does fix is the long-standing seam between live troubleshooting in vCenter and the wider observability story in Operations. Previously you’d jump to vCenter for the live picture, then back to Operations for context (alerts, capacity, related objects, log evidence) and try to stitch them together yourself. Now the live picture lives where the context already is.
It’s also a reasonable replacement for the “I’ll just SSH in and run esxtop” workflow when the question is more about correlating across objects than digging into a single host’s internals.
Enabling It
Install Real Time Metrics
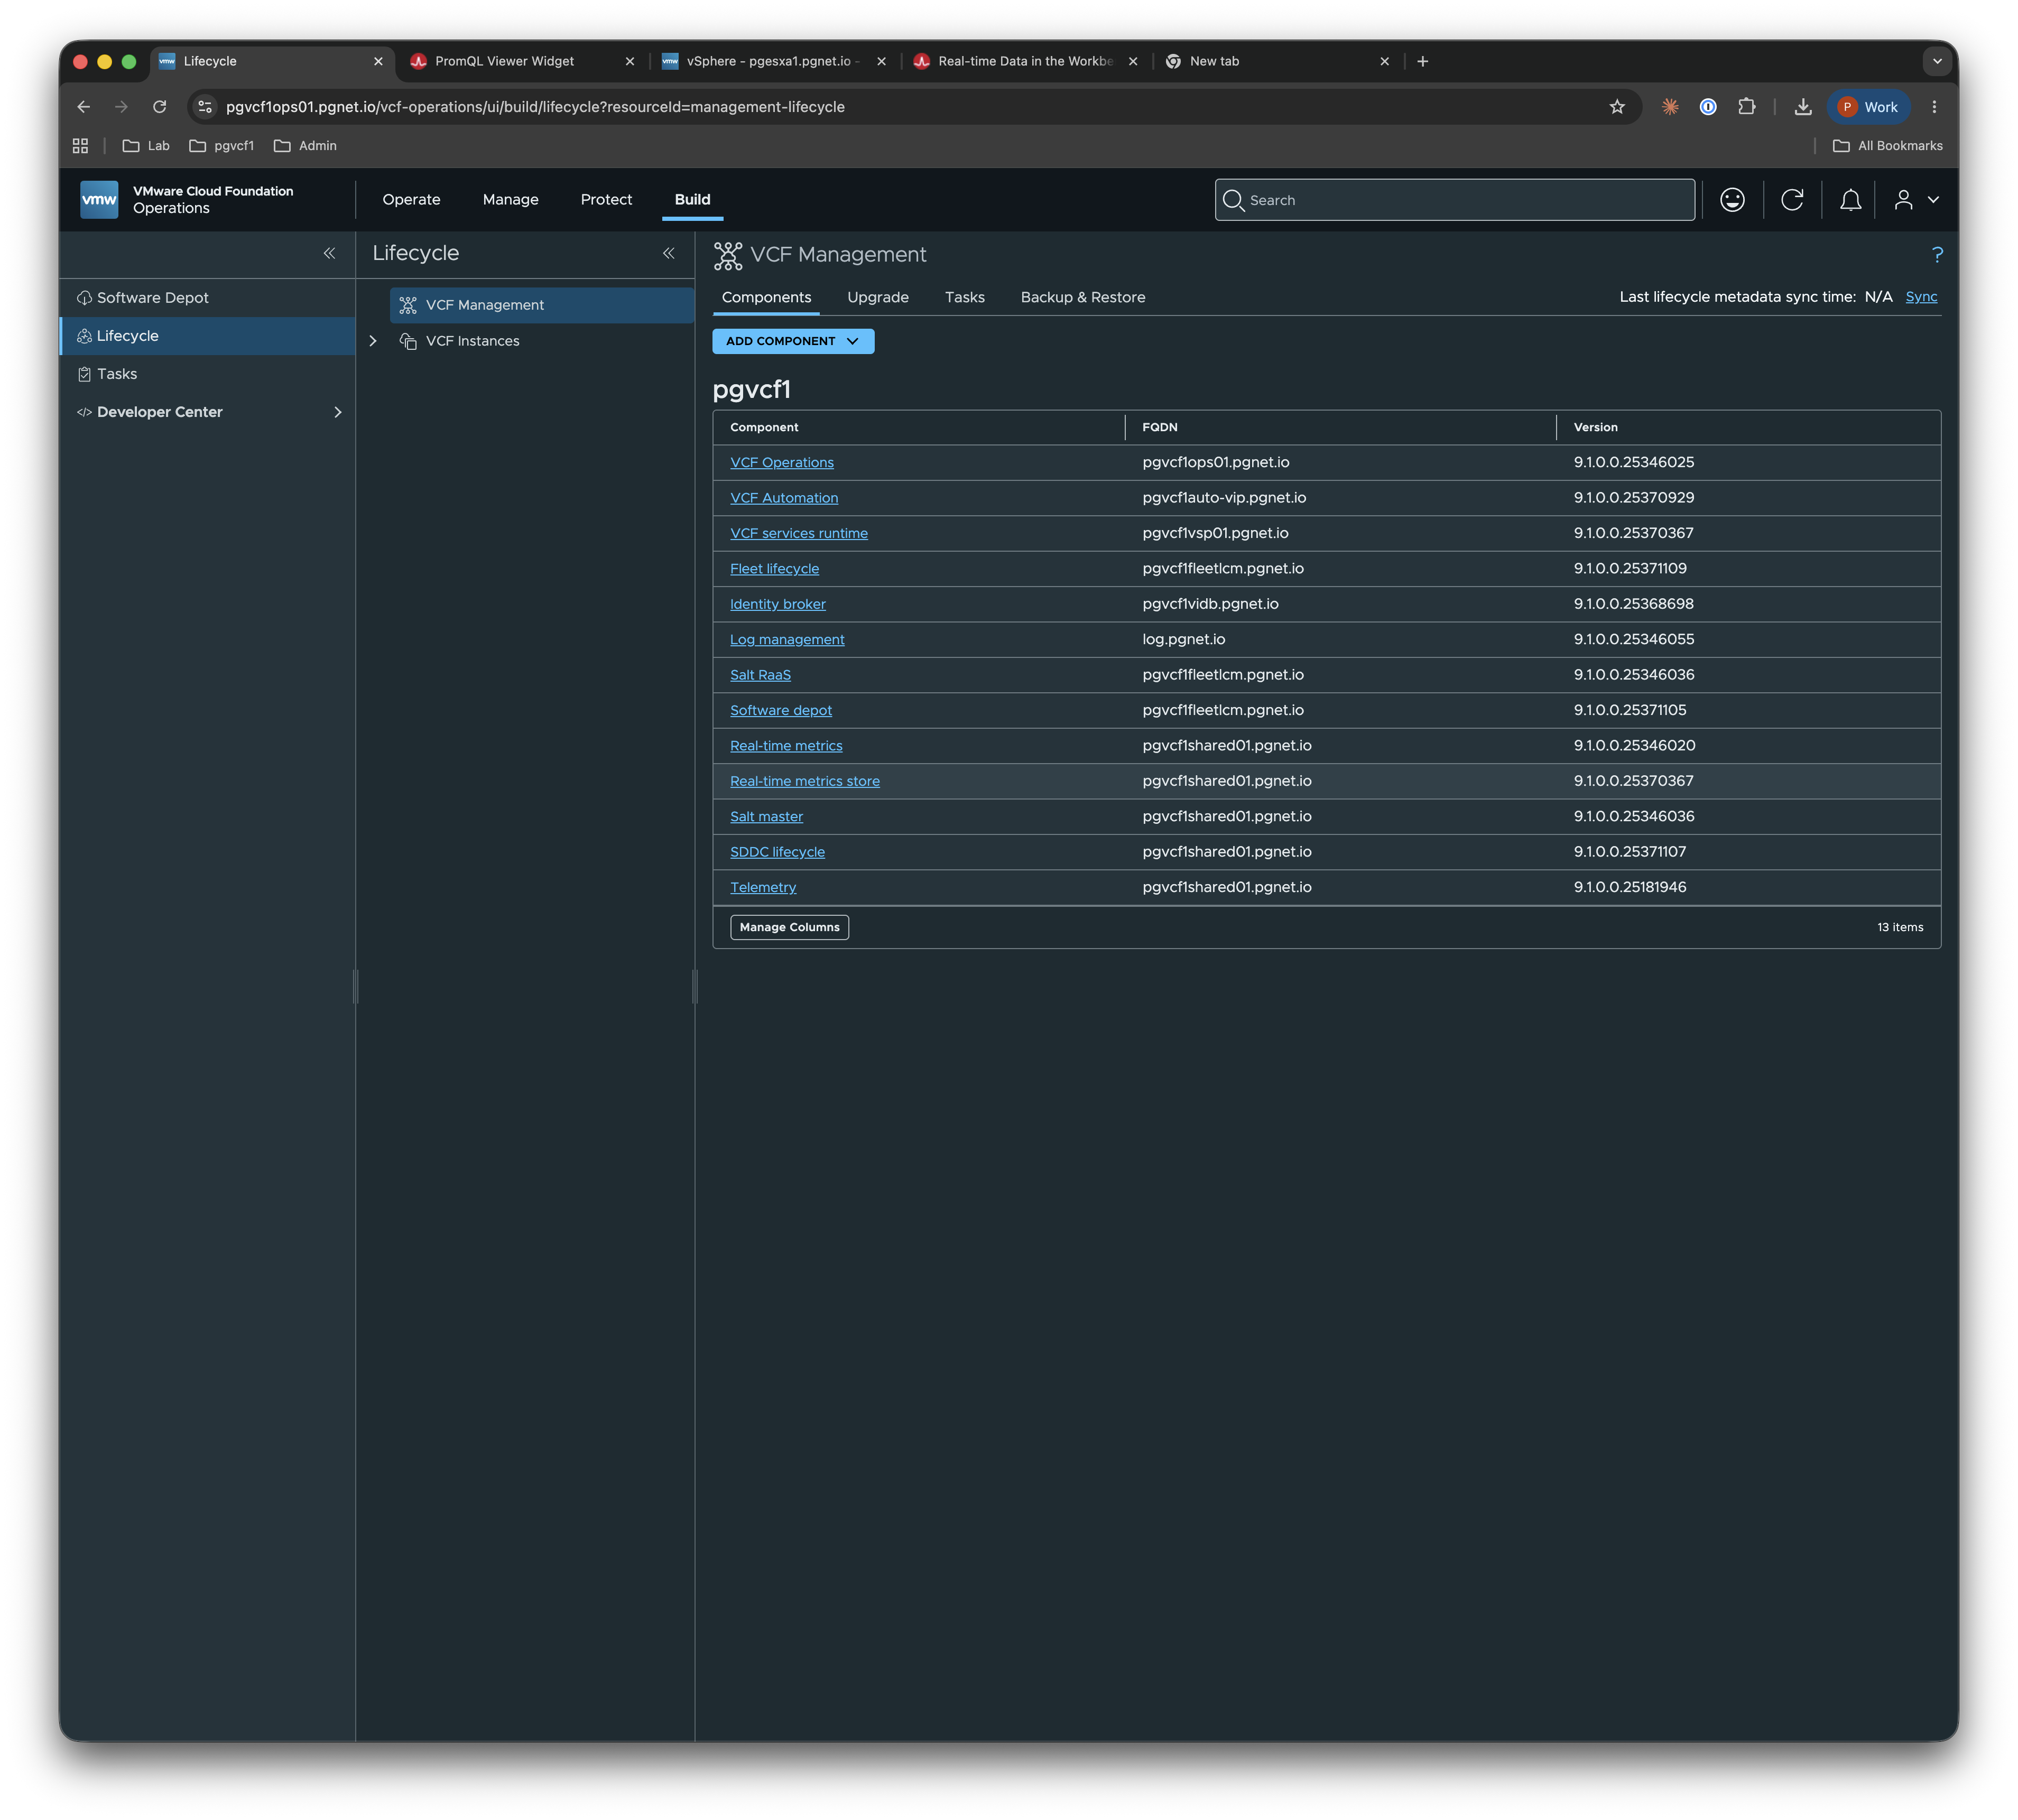
In VCF Operations, go to Build → Lifecycle → VCF Management → Add Component and install the Real-time metrics service (and its companion Real-time metrics store) onto your Services Platform host. Full instructions are in the Broadcom techdocs walkthrough.
Activate the Real Time category in policy
Next, enable the ESXi Top category in a policy that applies to the hosts you want high-resolution data for. Navigate to Operate → Administration → Configurations → Policy Definition:
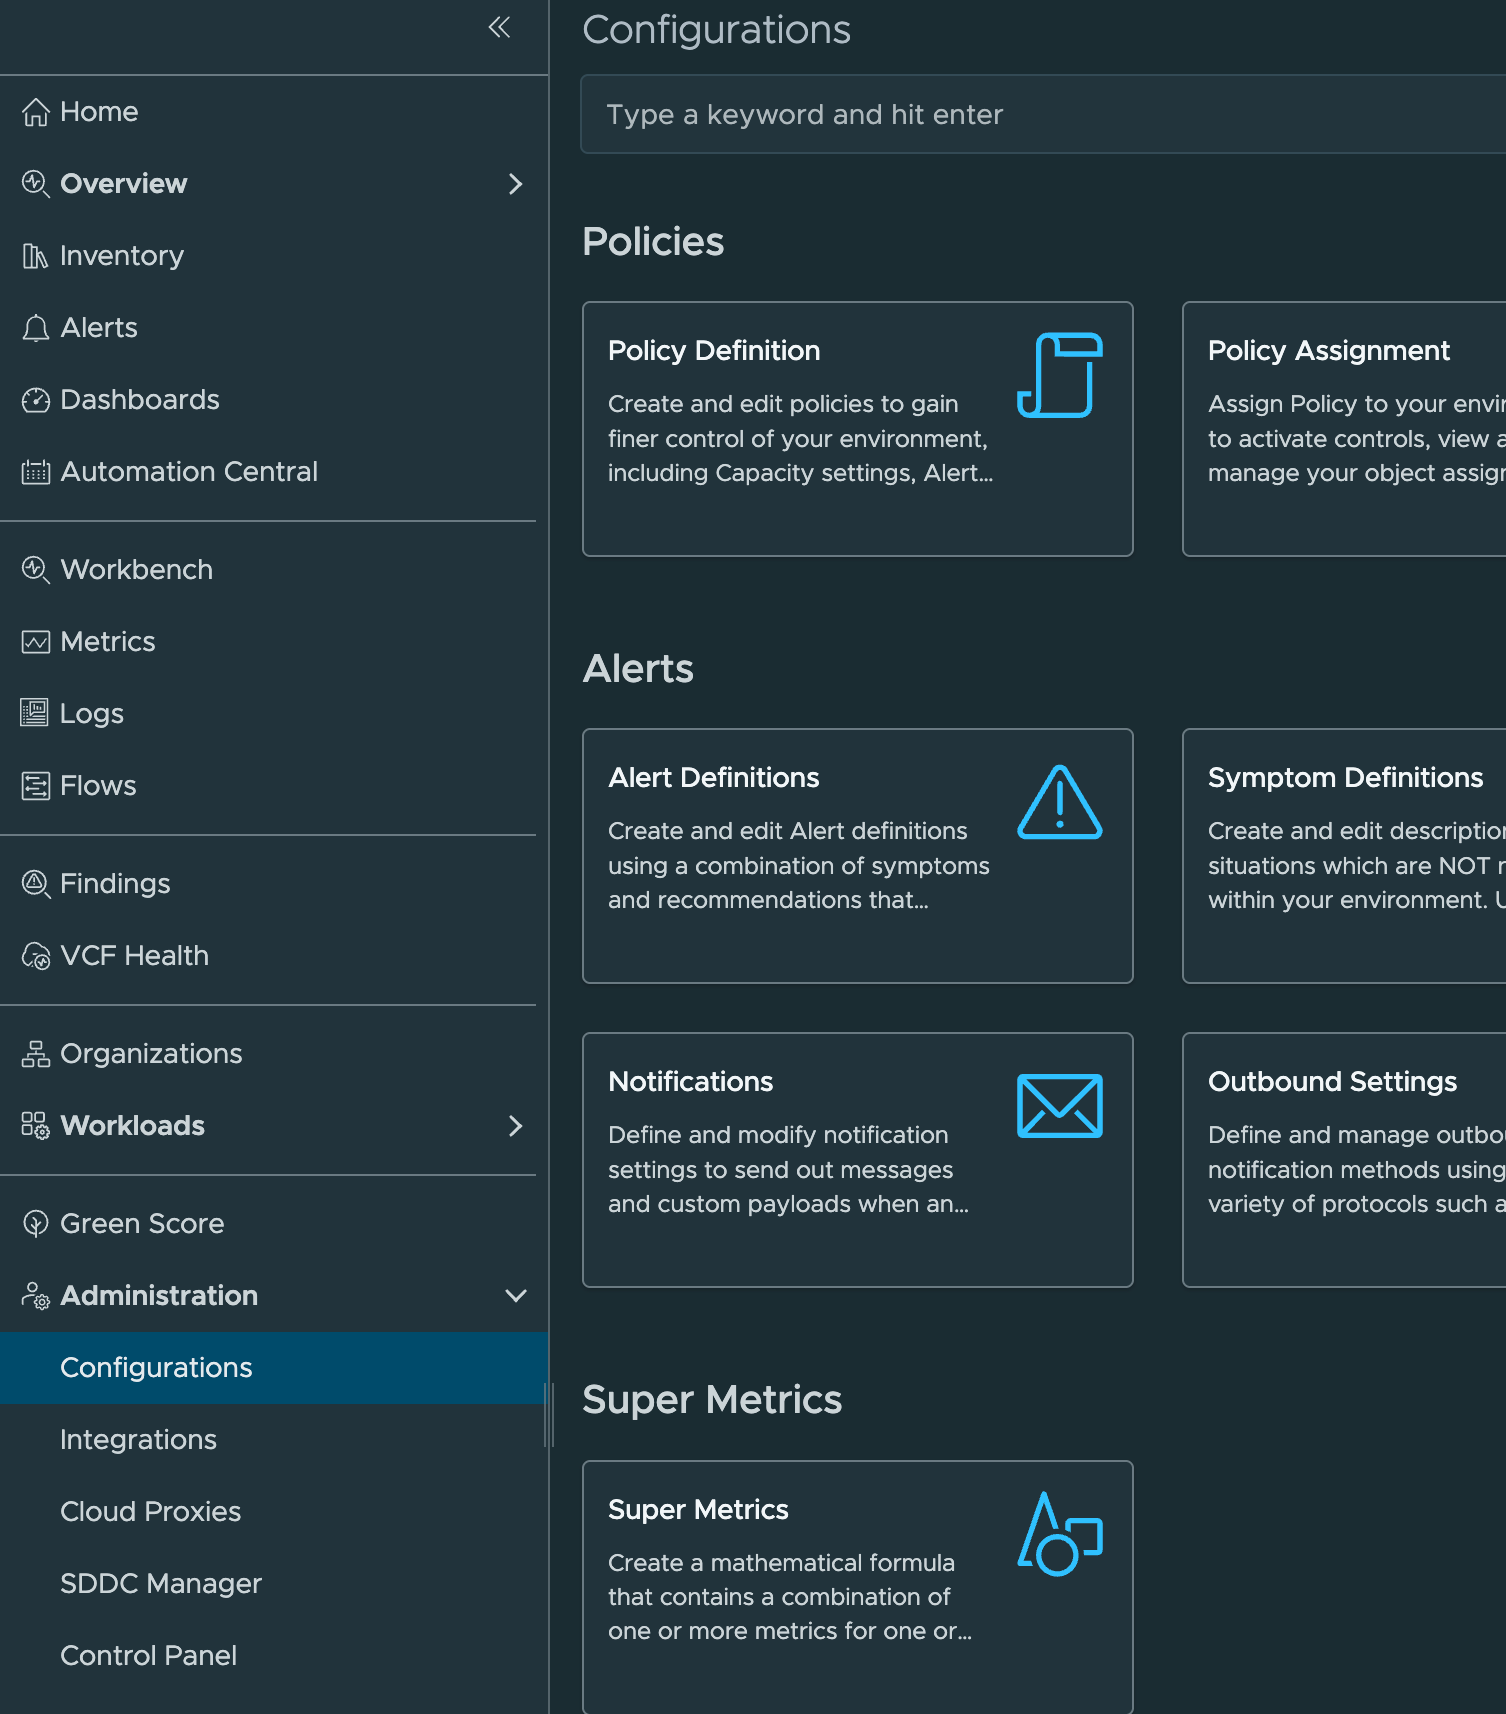
Pick the policy you want to edit — in my case the Default Policy — and find the Real time metrics section toward the bottom of the policy elements list:
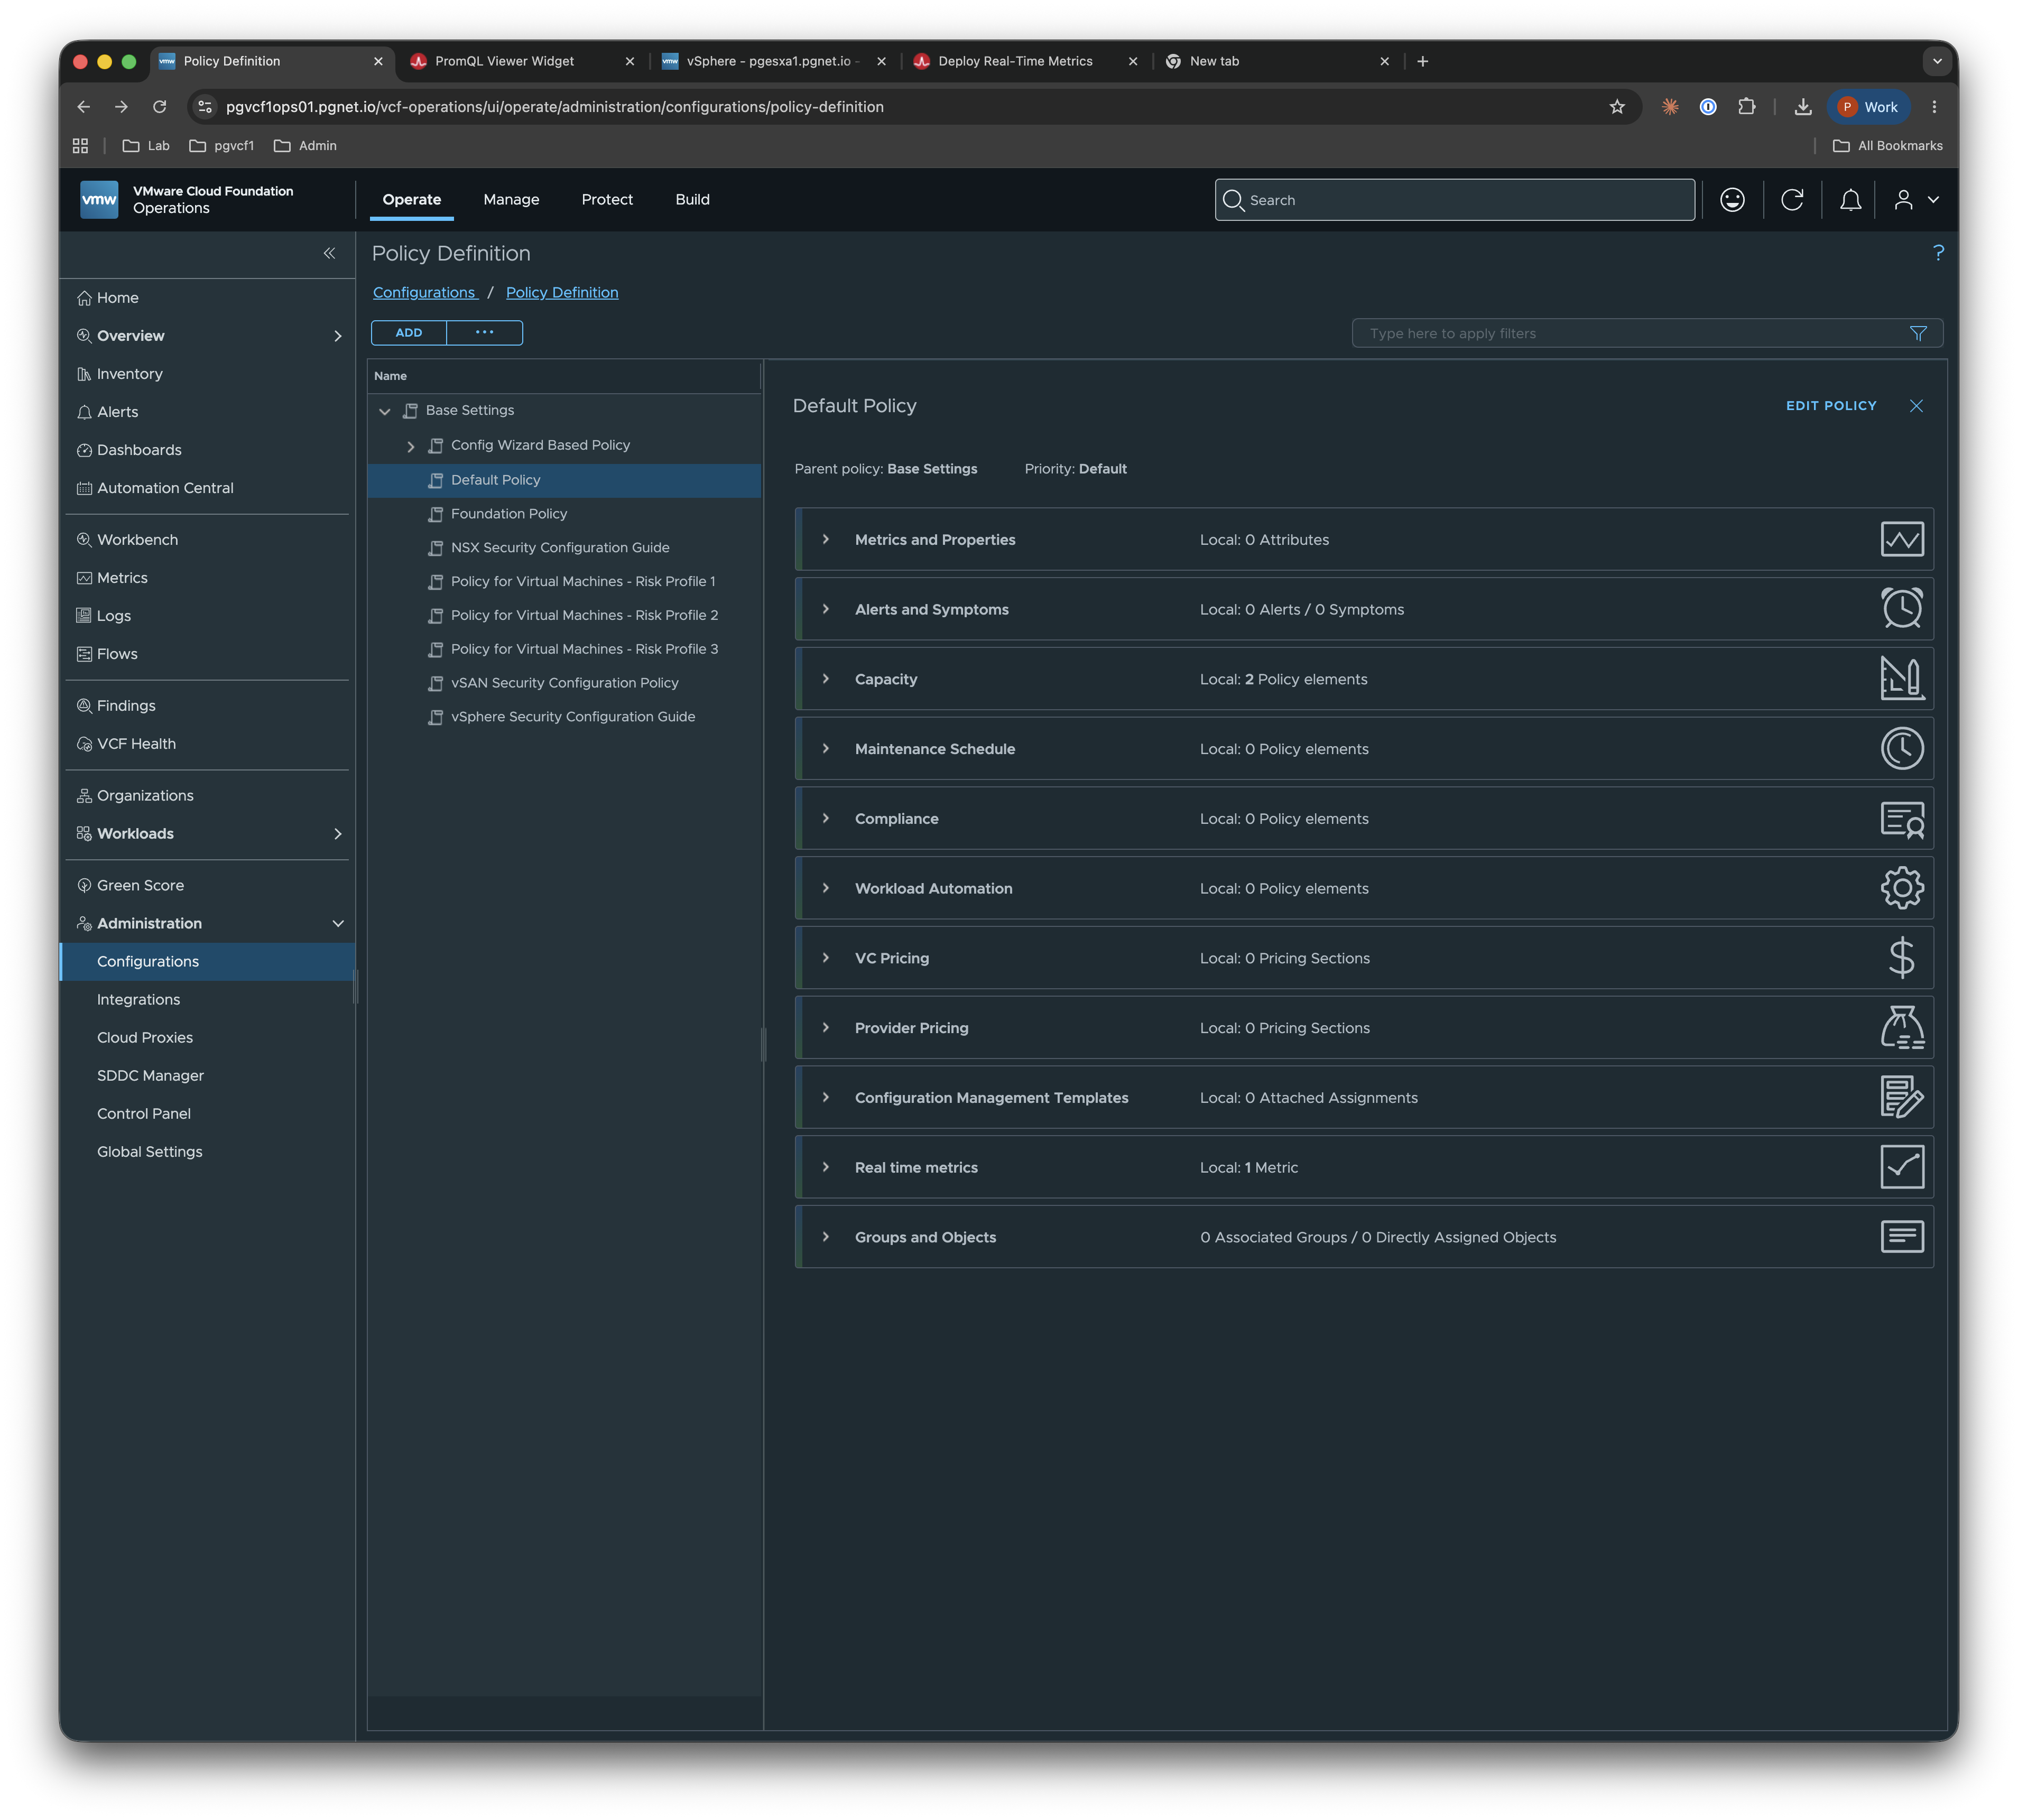
Edit it and activate ESXi Top for Object Type Host System under vCenter.
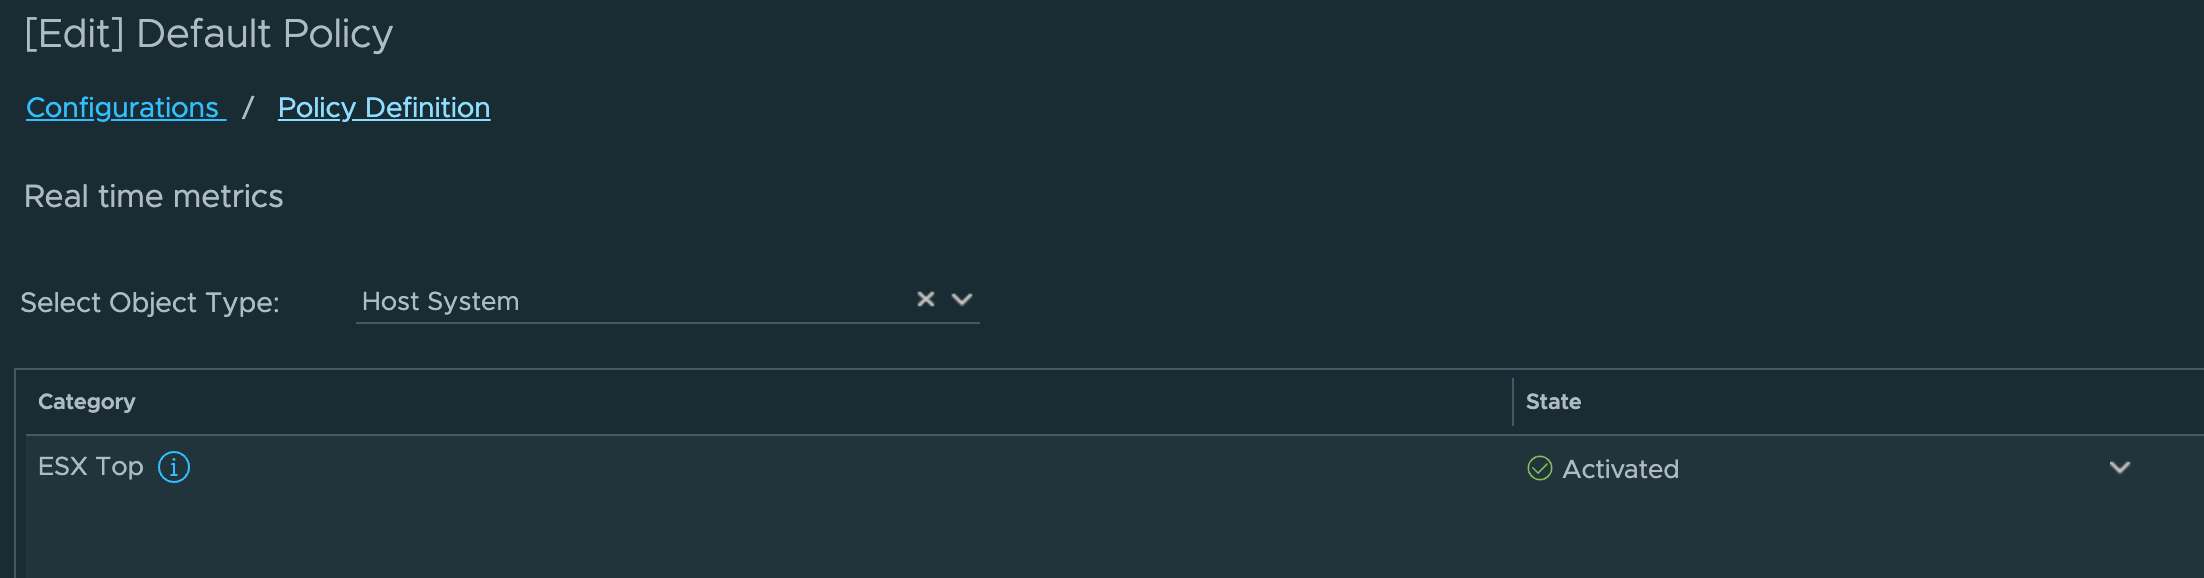
Save and collection starts after a cycle.
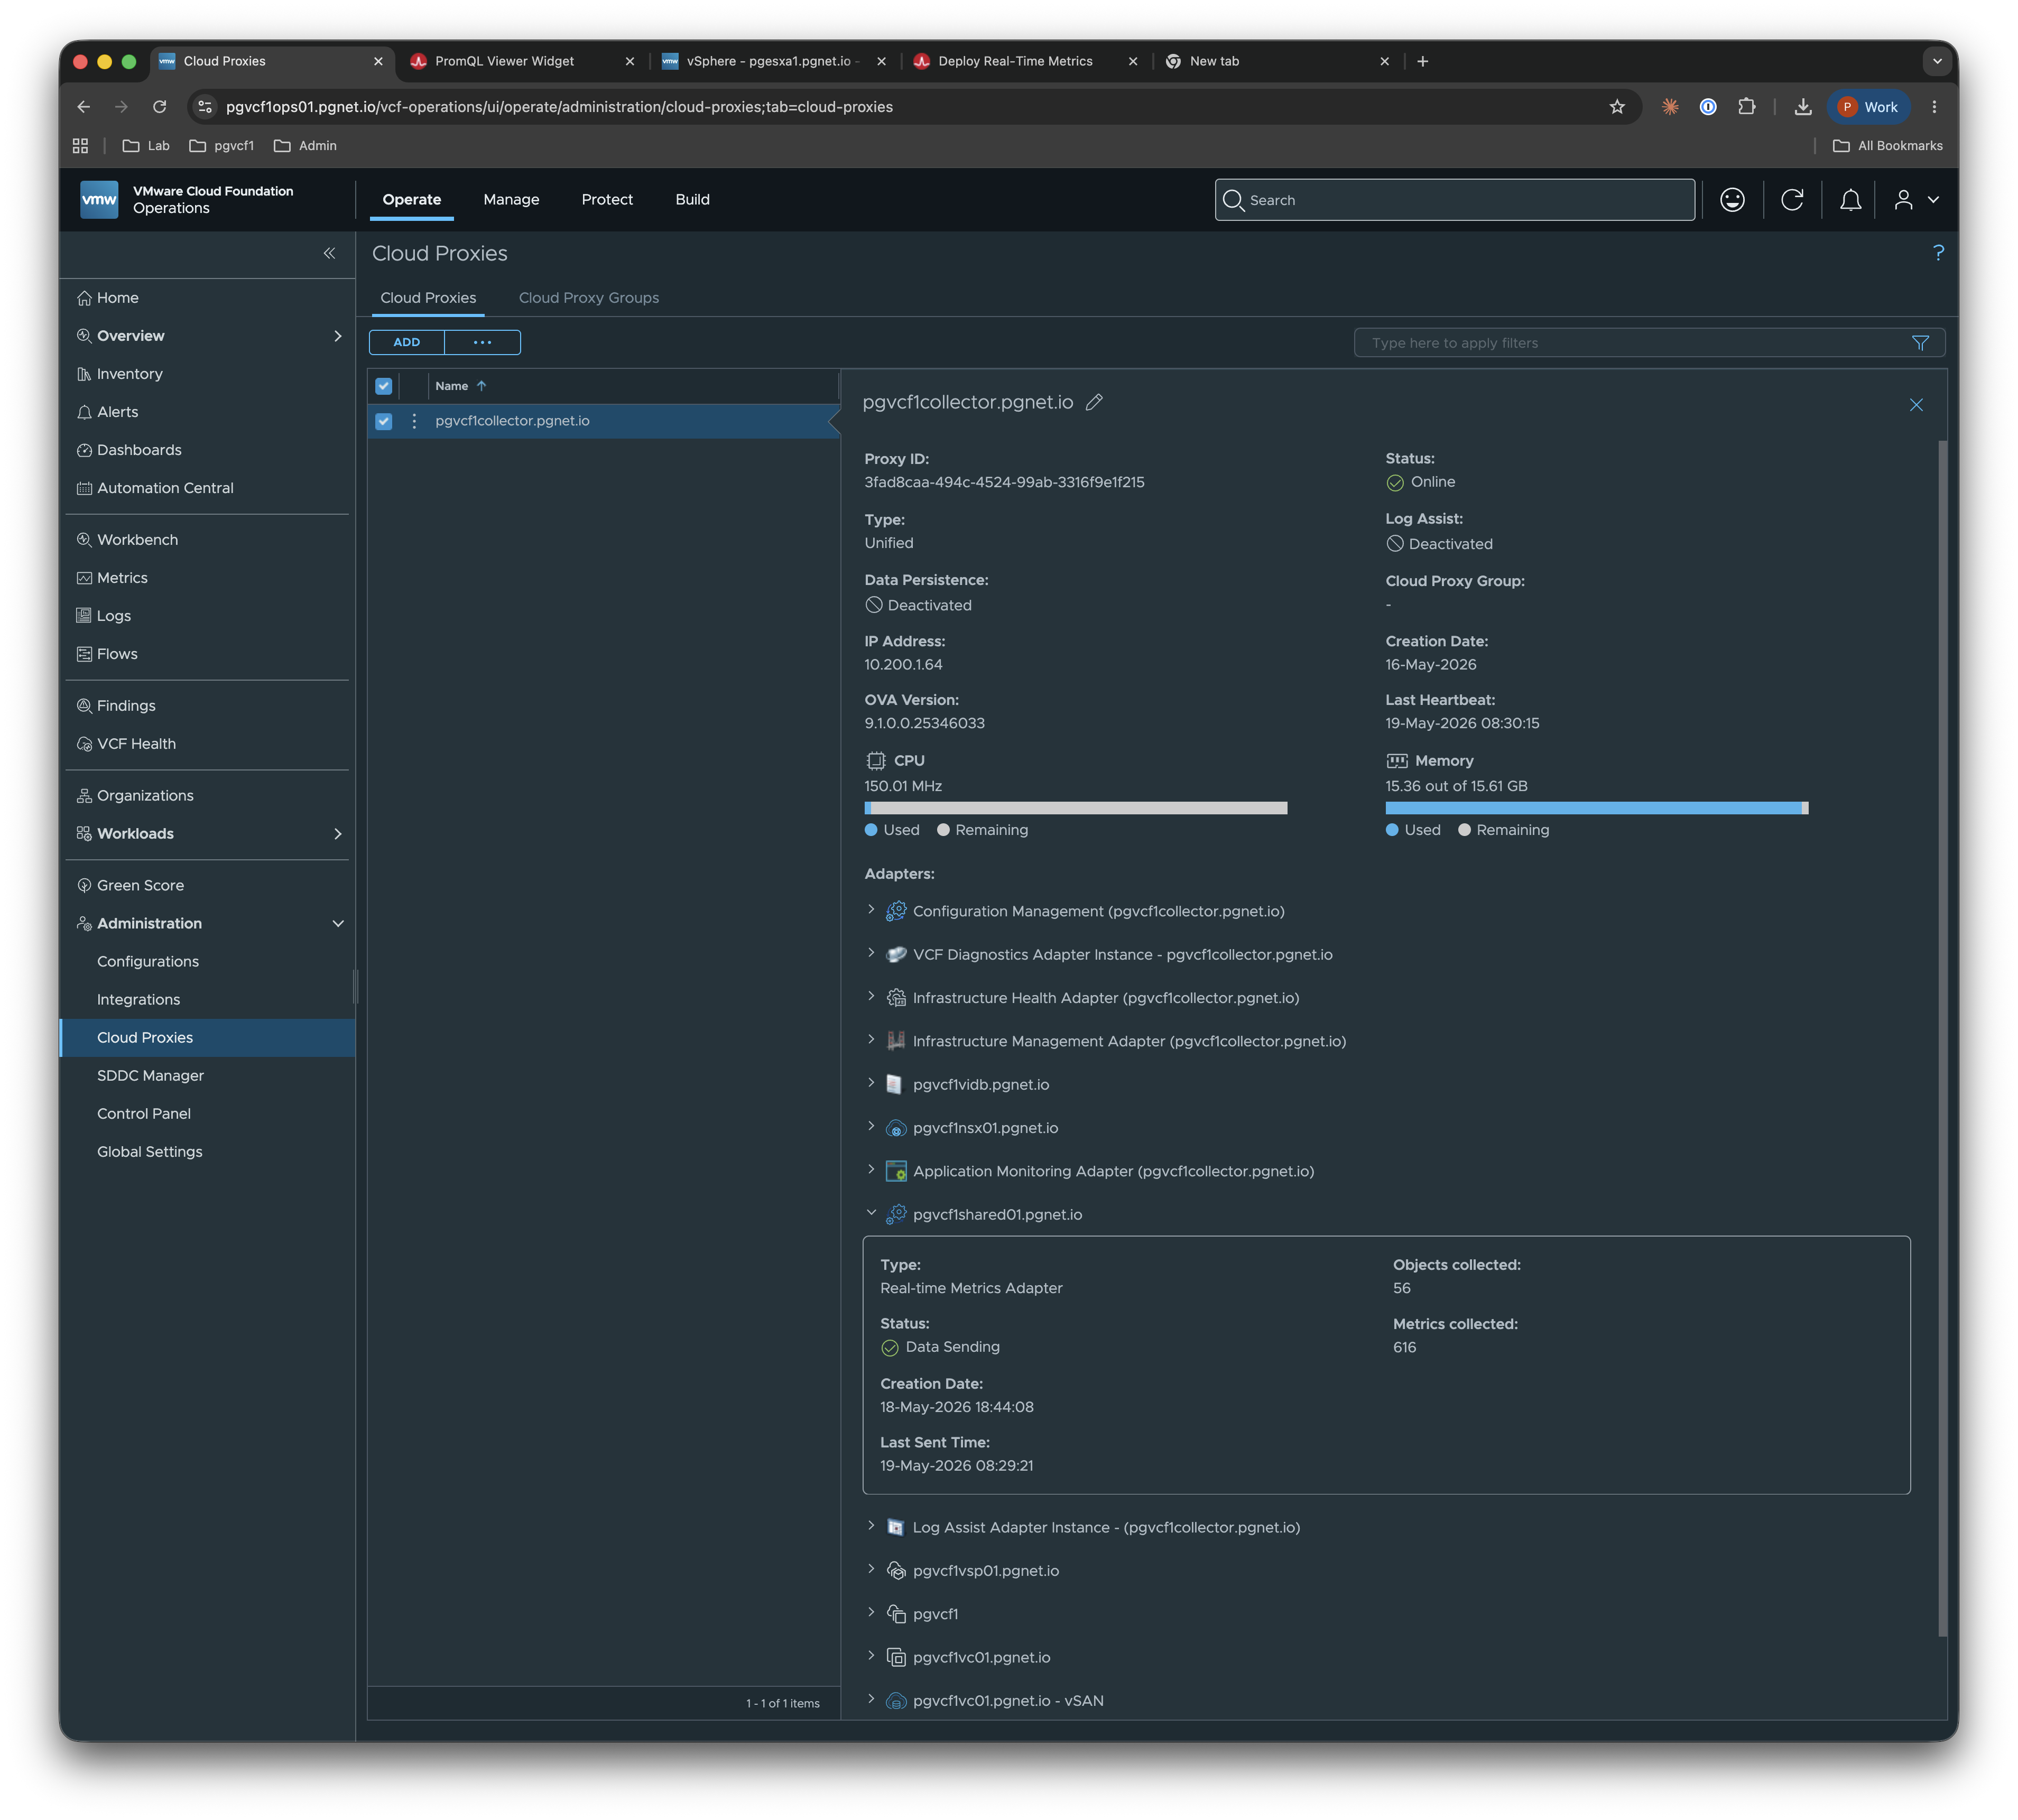
You can see the collection on the Cloud Proxy (56 objects collected in mine):
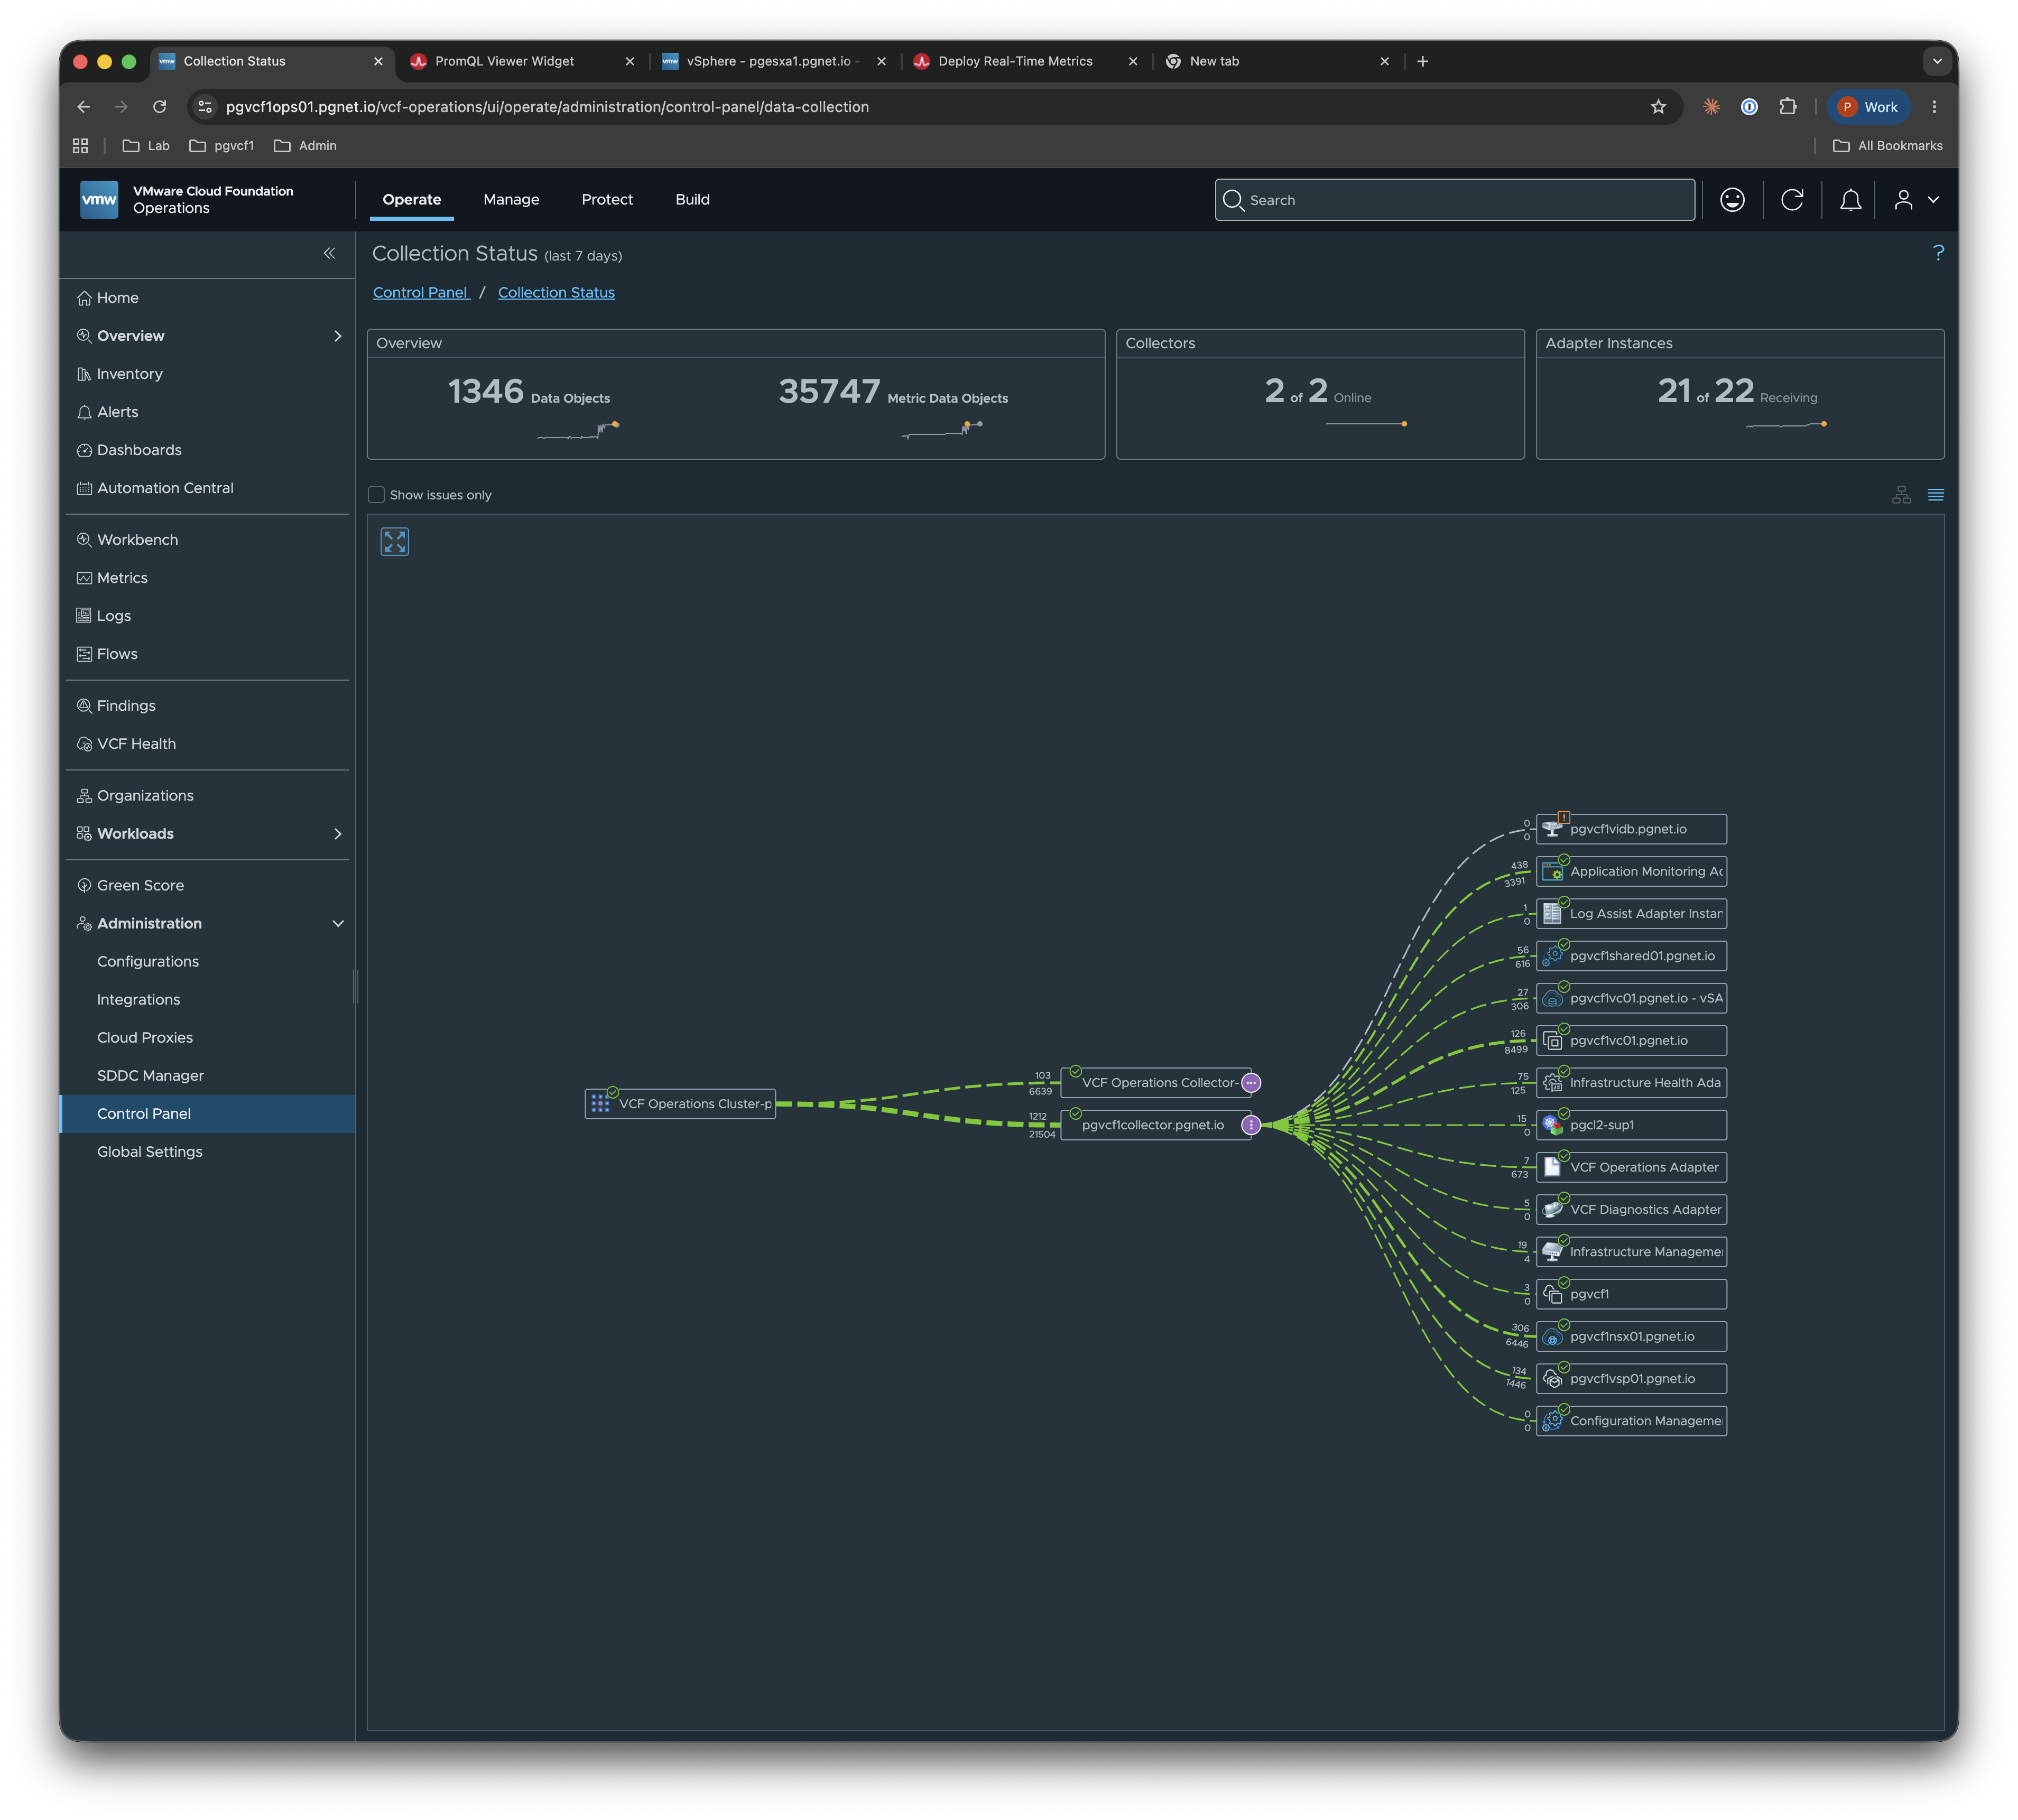
Or in Collection Status:
Wrap up
If you do any kind of live performance triage on VCF, the Workbench’s real-time data is worth ten minutes of your day to try. Spin up a saved session against a host you actually care about, pick the two or three metrics you’d normally hunt for in vCenter, and leave it open the next time someone files a “things feel slow” ticket. The win isn’t the 2-second granularity by itself — it’s that the granularity finally lives in the same place as the rest of your evidence.